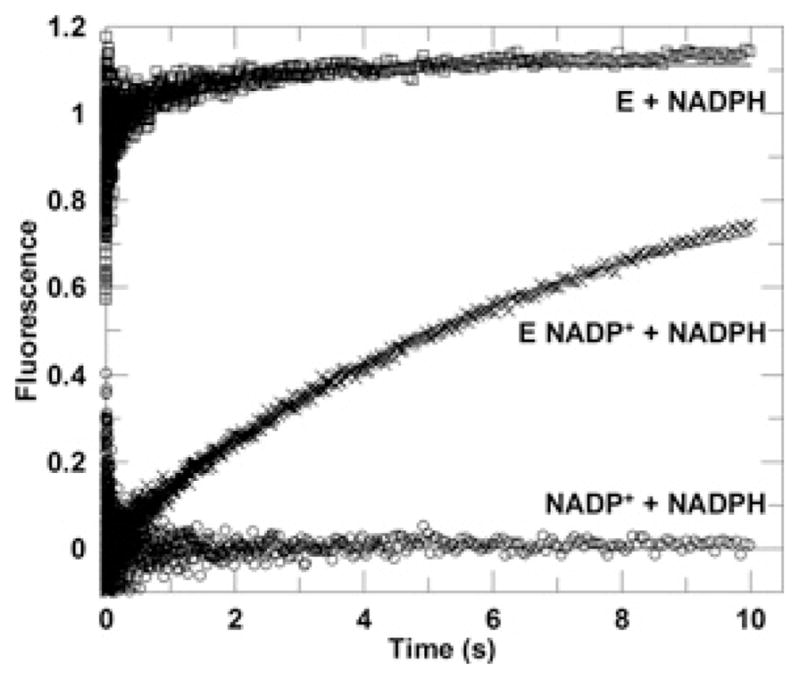
Figure 6. Representative kinetic traces from competition of cofactor binding.

The averaged progress curve of the energy transfer fluorescence signal observed upon mixing an enzyme solution with excess NADPH solution. The final sample contained 0.5 μM AKR1D1 and 50 μM NADPH (□).The averaged progress curve observed upon mixing an enzyme–NADP + solution with excess NADPH solution. The final sample contained 0.5 μM AKR1D1, 2.5 μM NADP + and 50 μM NADPH (×). The averaged progress curve observed upon rapid mixing an NADP + solution with excess NADPH solution. The final sample contained 2.5 μM NADP + and 50 μM NADPH (○). Data for the E (enzyme) + NADPH line (□) were fitted to a double-exponential function, whereas data for E NADP + + NADPH line were fitted to a single-exponential function (×). The fitted lines are shown in grey.
