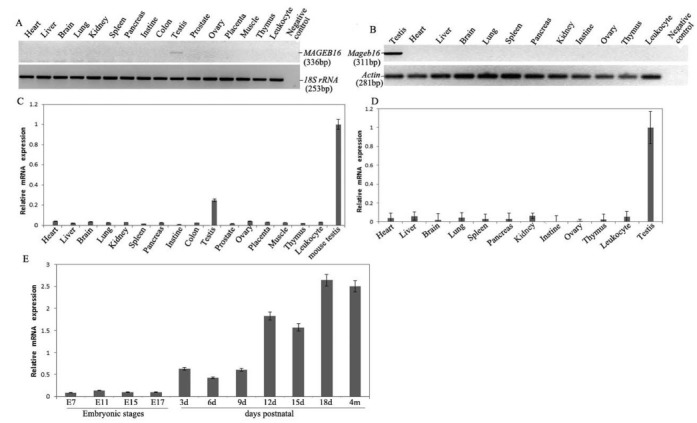
Fig. 1. The expression profile of the MAGEB16 and Mageb16 genes in human and mouse tissues and cells. (A) RT-PCR analysis of MAGEB16 mRNA from 16 human tissue and cell samples. (B) RT-PCR analysis of Mageb16 mRNA from 12 mouse tissue and cell samples. (C) QRT-PCR analysis of MAGEB16 mRNA from 16 human tissue and cell samples. The amount of Mageb16 mRNA in mouse testis was used as a control and was set to 1 arbitrary unit. (D) QRT-PCR analysis of Mageb16 mRNA from 12 mouse tissue and cell samples. (E) QRT-PCR analysis of Mageb16 mRNA from embryos and testis from different developmental stages. The column labeled “4 m” indicates mRNA extracted from the testis of 4-month-old mice.

