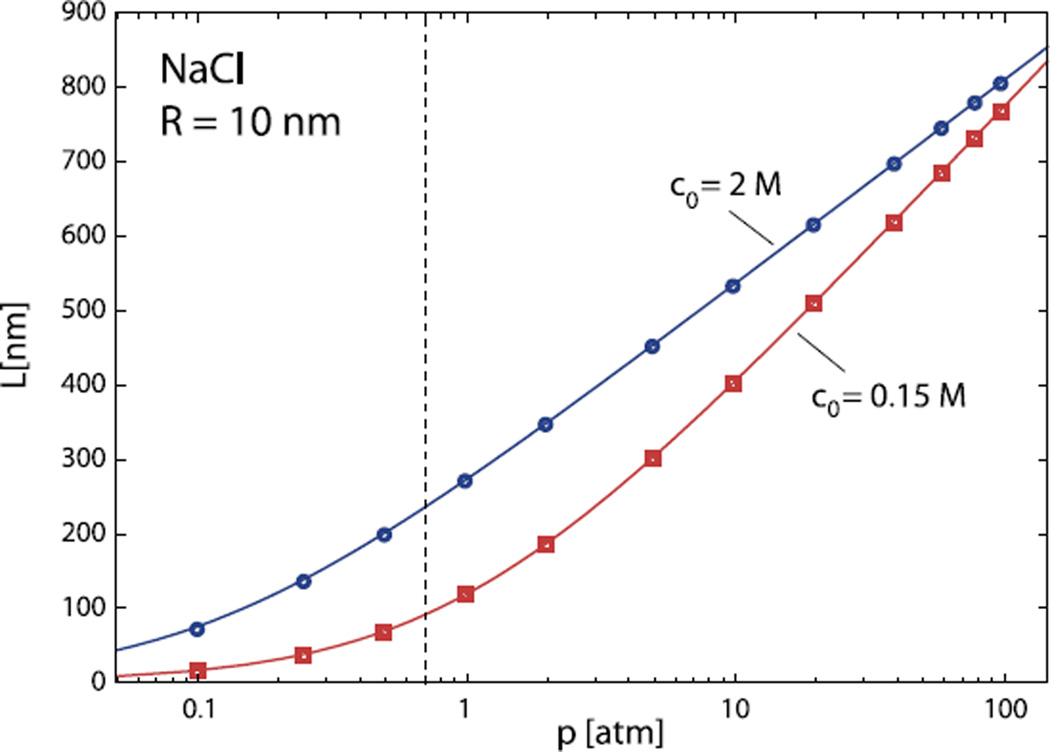
Fig. 2.
The length of the encapsidated DNA as a function of the osmotic pressure in the solutions containing 0.15 M (squares) and 2 M of NaCl (diamonds). The symbols denote numerical results obtained by solving equation (11). Full lines are predictions of equation (15). The capsid radius in these calculations is R = 10 nm. The region of bulk osmotic pressures left from the vertical dashed line is not determined in the osmotic stress experiments and was obtained by extrapolating the existing results in the way indicated in reference [28]. The relative error in L changes with pressure and depends on the relative errors of osmotic pressure and DNA density measurements in the bulk. It is smallest at high pressures (typically below 7%).

