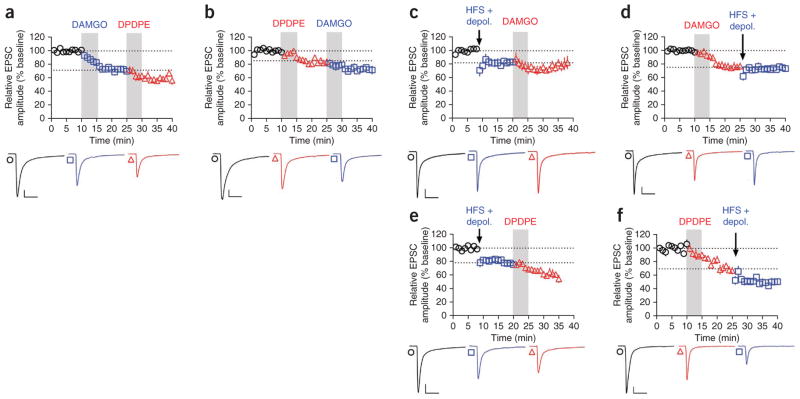
Figure 5.
mOP- and dOP-LTD operate independently. (a) DPDPE (0.3 μM, 5 min) induced LTD of eEPSC amplitude beyond that induced by DAMGO (0.3 μM, 5 min; versus DAMGO, P = 0.0178, t6 = 3.237, n = 7). (b) DAMGO (0.3 μM, 5 min) induced LTD beyond that induced by DPDPE (0.3 μM, 5 min; versus DPDPE, P = 0.0055, t6 = 4.222, n = 6). (c) eCB-LTD, induced by high-frequency stimulation (HFS, 4× 1 s at 100 Hz, 10 s apart) paired with depolarization to 0 mV, occluded LTD induced by DAMGO (0.3 μM, 5 min; versus HFS, P = 0.1121, t7 = 1.817, n = 8). (d) DAMGO (0.3 μM, 5 min) occluded eCB-LTD (versus DAMGO, P = 0.5372, t8 = 0.6447, n = 10). (e) eCB-LTD did not occlude LTD induced by DPDPE (0.3 μM, 5 min; versus HFS, P = 0.0013, t6 = 5.668, n = 7). (f) DPDPE (0.3 μM, 5 min) did not occlude eCB-LTD (versus DPDPE, P = 0.0208, t6 = 3.111, n = 7). Representative traces are the average of the first 10 min (first of each triplet), the 5 min before initiation of second treatment (second of each triplet), and final 5 min of recording (third of each triplet). Scale bars represent 50 pA, 50 ms. All error bars indicate s.e.m. Data in a–f were analyzed with Student’s paired t tests.

