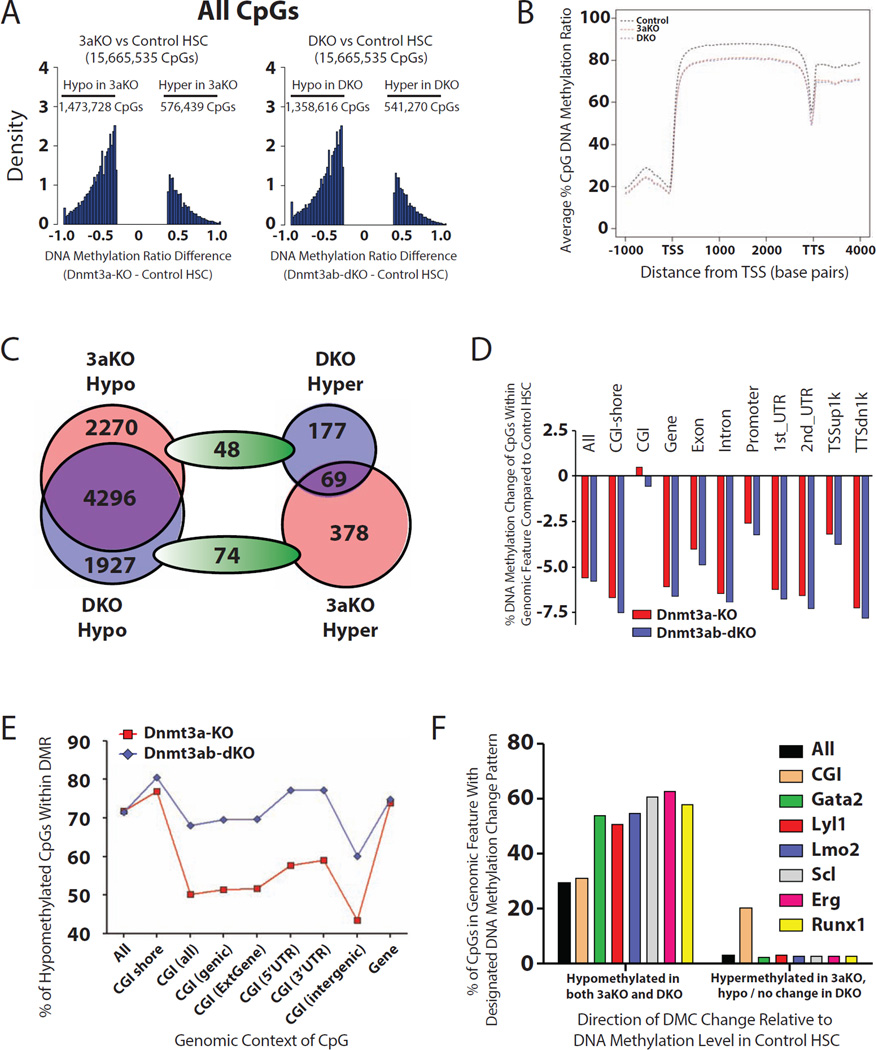
Figure 3. Global DNA methylation defects in Dnmt3-mutant HSCs.
(A) Distribution of all DMCs in the genome of Dnmt3-mutant HSCs relative to control from WGBS data. (B) Average DNA methylation profile of CpGs across genic elements in control, 3aKO and DKO HSCs. (C) Distribution of DMCs within CGIs of Dnmt3-mutant HSCs compared to control. (D) Average DNA methylation changes across genomic elements in Dnmt3-mutant HSCs relative to control. (E) Percentages of hypomethylated DMCs within genomic elements in Dnmt3-mutant HSCs compared to control. (F) Hypomethylated DMCs are enriched in transcription factor binding sites, hypermethylated DMCs in 3aKO HSCs are enriched in CGIs. See also Figure S3 and Tables S1, S2 and S3.

