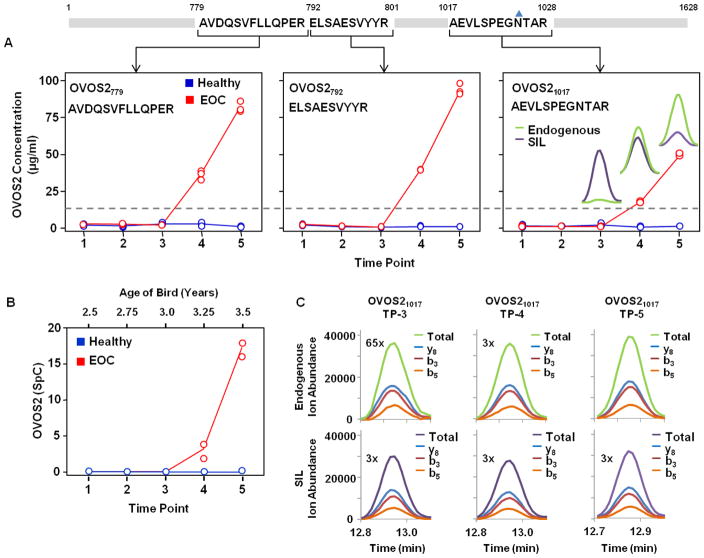
Figure 4.
Absolute quantification for OVOS2 based on three different signature peptides (A) follow the same trend as the label-free SpC data demonstrated by Hawkridge et al.28 (B). Each peptide exhibits an increase in OVOS2 concentration as a function of time in the EOC bird and no OVOS2 is detected in the Healthy bird. The grey dashed line indicates a signal to noise ratio of 10. The chromatographic peaks inset in (A) OVOS21017 demonstrate the endogenous peptide signal (green) compared to the SIL peptide signal (purple), and correspond to the representative raw data for peptide OVOS21017 time point 3 (TP-3), time point 4 (TP-4), and time point 5 (TP-5) in the EOC bird (C). The ion abundance from each transition contributing to the overall signal used for computing absolute concentration of the protein are set to the same scale and magnified as denoted in (C). The blue triangle above the 1025-arginine represents potential N-linked glycosylation.

