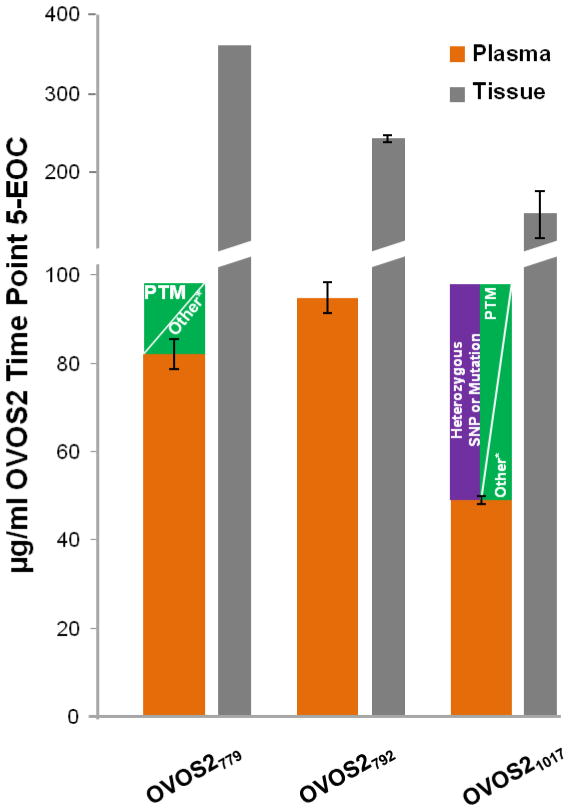
Figure 5.
Absolute concentration plot of OVOS2 with each peptide employed for plasma time point 5 (orange) and the ovary tissue (grey) samples. The y-axis is not of the equivalent scale throughout which is indicated by the break in the axis. Potential reasons for underestimation of protein concentration by OVOS2779 and OVOS21017 as compared to OVOS2792 are included for the plasma sample. The asterisk (*) indicates other possible influences of variability in concentration including chemical modifications, degradation, and poor digestion efficiency.

