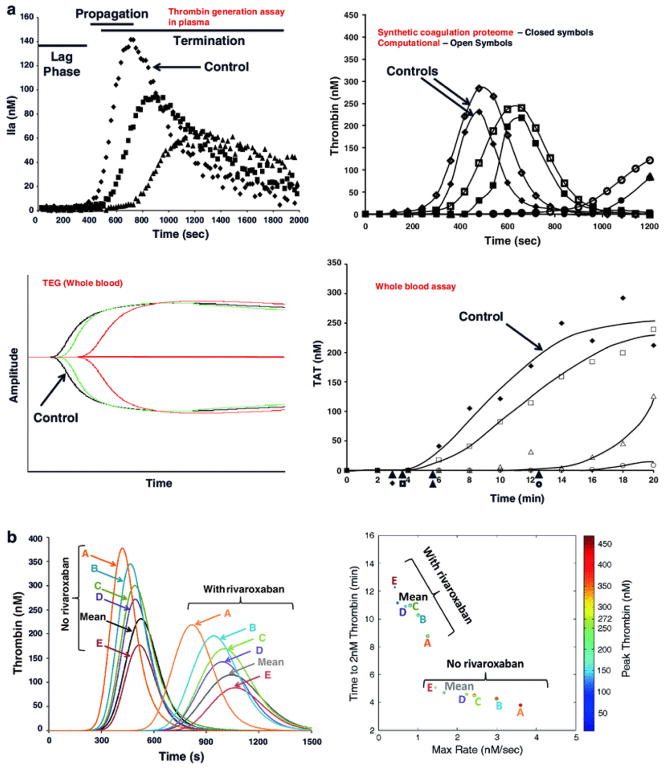
Figure 2.
Global empirical thrombin assays. A) Thrombin generation assay in plasma. B) Purified protein-based synthetic coagulation proteome compared to the respective computational model. C) Thromboelastography. D) Whole blood assay. E) Computational analysis of the effect of equivalent doses of rivaroxaban on different individual profiles. F) Extraction of the thrombin parameters from the previous data into a unique four parameter graph displaying maximum rate (x-axis), maximum level (color), clot time (y-axis) and total thrombin generated (size). Reprinted with permission from [18].

