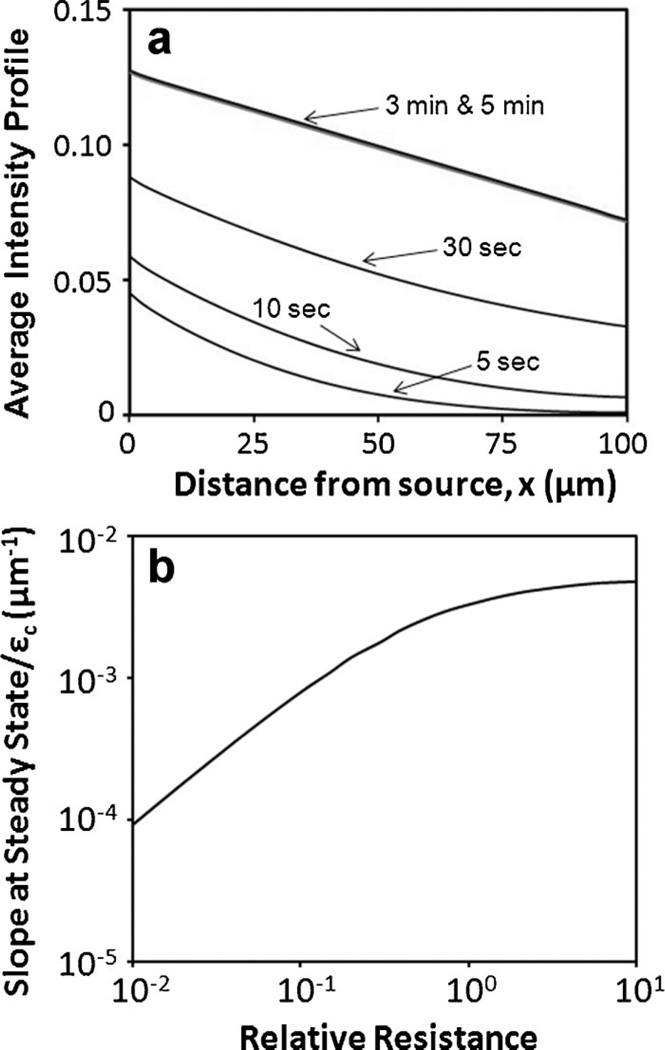
Figure 6.
Numerical simulation of average concentration profiles of NaF across the central channel. The time-dependent concentration profiles normalized by c0 were assumed to be the same as the average intensity profiles (Imean/Imax). They are plotted in panel (a) for different time points. The profiles at 3 and 5 min were approximately the same, suggesting that the profiles had reached a steady state at 5 min. The steady state profile could be compared to Imean/Imax measured experimentally. The slope of the steady state profile, normalized by εc, is shown in panel (b). It depended only on the resistance to NaF diffusion in the cell compartment relative to that in the gaps between posts.

