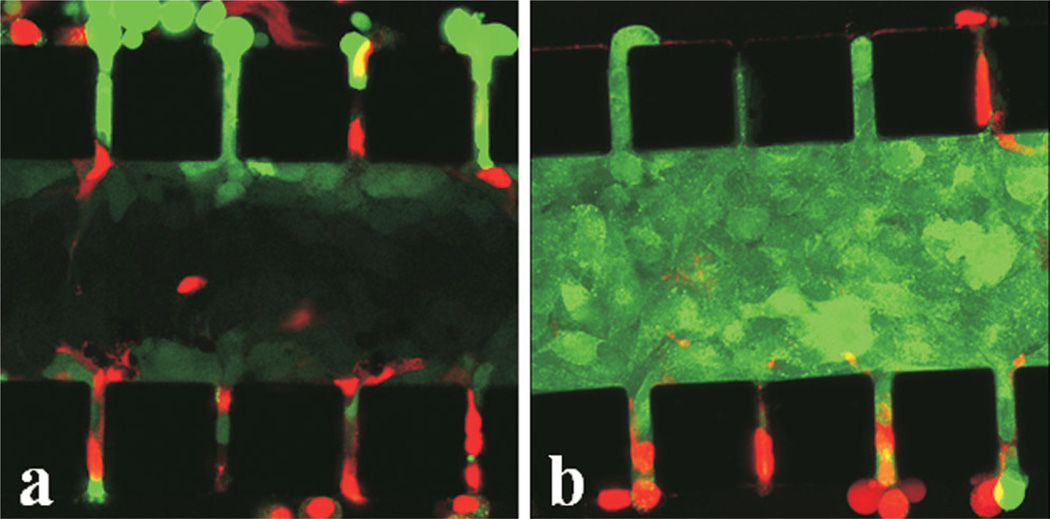
Figure 9.
Distribution of calcein-AM in microfluidic channel. a: Both outer channels were perfused with a solution of calcein-AM (10 µM) and PI (10 µM) at 12-h post cell loading. The perfusion was performed for 20 min at 37°C. The image was taken immediately after the perfusion. b: Cells in the image were pre-incubated in the same solution of calcein-AM and PI for 20 min at 37°C before they were loaded into the microfluidic channel. The image was taken at 12-h post cell loading. [Color figure can be seen in the online version of this article, available at http://wileyonlinelibrary.com/bit]

