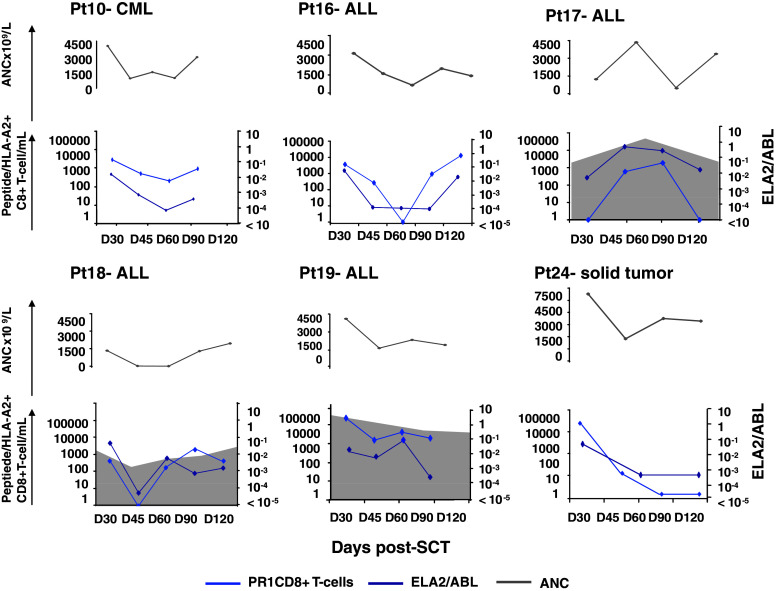
Fig. 3.
PR1-specific CD8+ T-cell responses in peripheral blood in relation to ELA2 gene expression and absolute neutrophil count (ANC). Results in 6 individual patients are shown. The number of days after transplantation is shown on the x-axis. PR1/HLA-A*0201+ CD8+ T cells are expressed as absolute numbers/mL of peripheral blood (left, y-axis; light blue); the shaded area represents absolute numbers of CMVpp65495/HLA-A*0201+ CD8+ T cells. ELA2 gene expression in peripheral blood is expressed as the ratio of ELA2 to ABL (right, y-axis; dark blue). The ANC × 109/L are represented at each time point (gray line)

