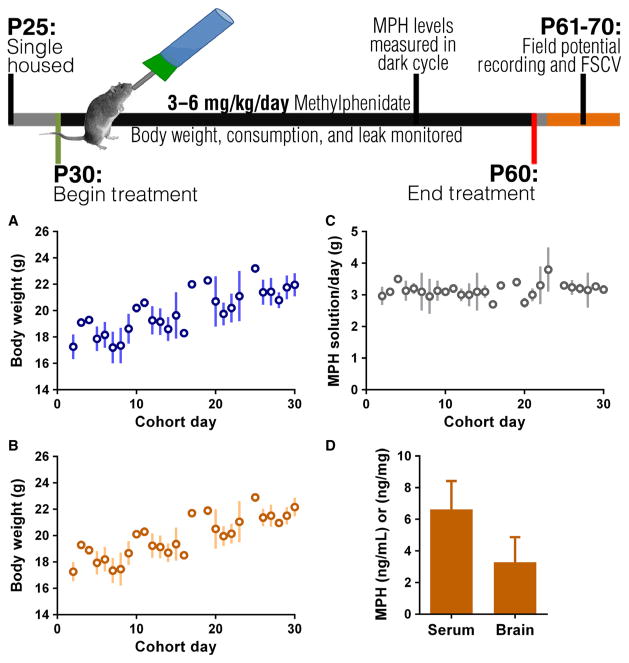
Fig. 1.
Top: treatment and experimental timeline. (A, B) Linear regression of body weight gain for control (A) and MPH (B) groups across days of treatment. Body weight increases throughout study (P < 0001). (C) MPH solution consumed per day corrected for leak. Consumption remains consistent throughout study. (D) MPH levels measured in trunk blood and brain at 6 h into the dark cycle. FSCV, fast-scan cyclic voltammetry.

