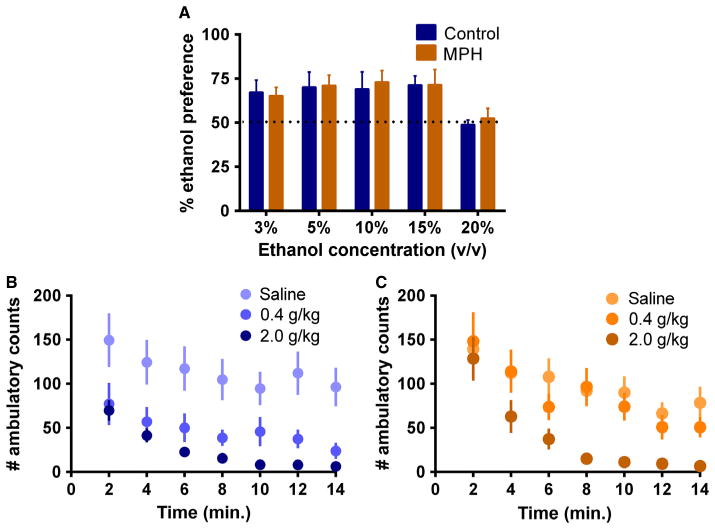
Fig. 5.
Ethanol preference and locomotor activity following i.p. ethanol. (A) Two-bottle choice of water and increasing concentrations of ethanol (v/v) shows no differences between control and MPH-treated animals. Preference values reflect ethanol consumed as a percentage of total liquid consumption. (B, C) Decreased locomotor depressant effect of a low dose of ethanol specifically in animals treated with MPH in adolescence. Locomotor activity reflected as ambulatory counts following a 0.4 g/kg (B) or 2 g/kg (C) i.p. injection of ethanol. Blue, control mice; orange, MPH-treated mice.

