
Figure 1.
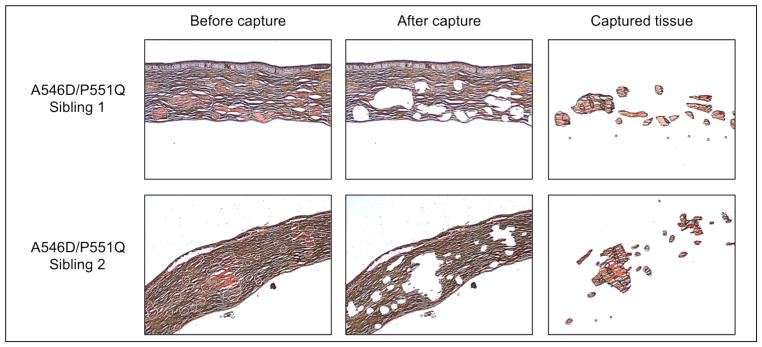
Corneal tissue section stained with Congo red. Upper row and lower row represent tissue sections of sibling 1 and 2, respectively. Left column; before laser capture, Middle column; after laser capture, and right column; corneal amyloid deposits isolated and used for further analysis. Light microscope, 4x magnification.