Figure 3.
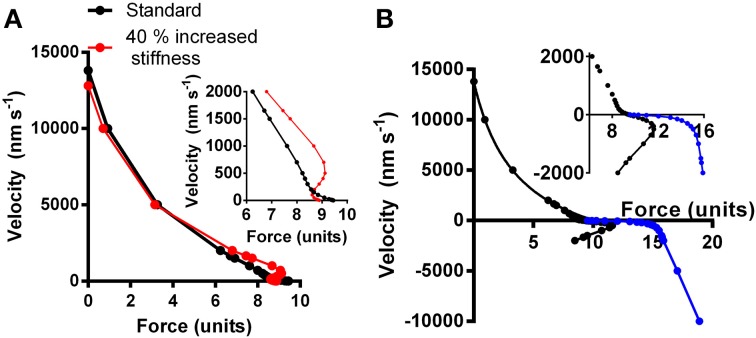
Simulated relationship between force and shortening (positive) and lengthening velocity (negative). (A) Black symbols and connecting lines: standard parameter values (Table S1; corresponding to normal healthy fast skeletal muscle). Red symbols and connecting lines: standard parameter values but cross-bridge stiffness increased by 40% without further changes in parameter values. Inset: simulated force-velocity data in the high force region shown in greater detail. (B) The force-velocity relationship for the standard conditions in (A) re-plotted together with simulated lengthening part of the relationship either assuming same attachment rate as during shortening and isometric contraction (Equation S4a; black symbols) or assuming increased attachment rate with increased velocity of lengthening (Equation S4b; blue symbols). The latter data are reasonably consistent with experimental data (Lombardi and Piazzesi, 1990) whereas the former are not.

