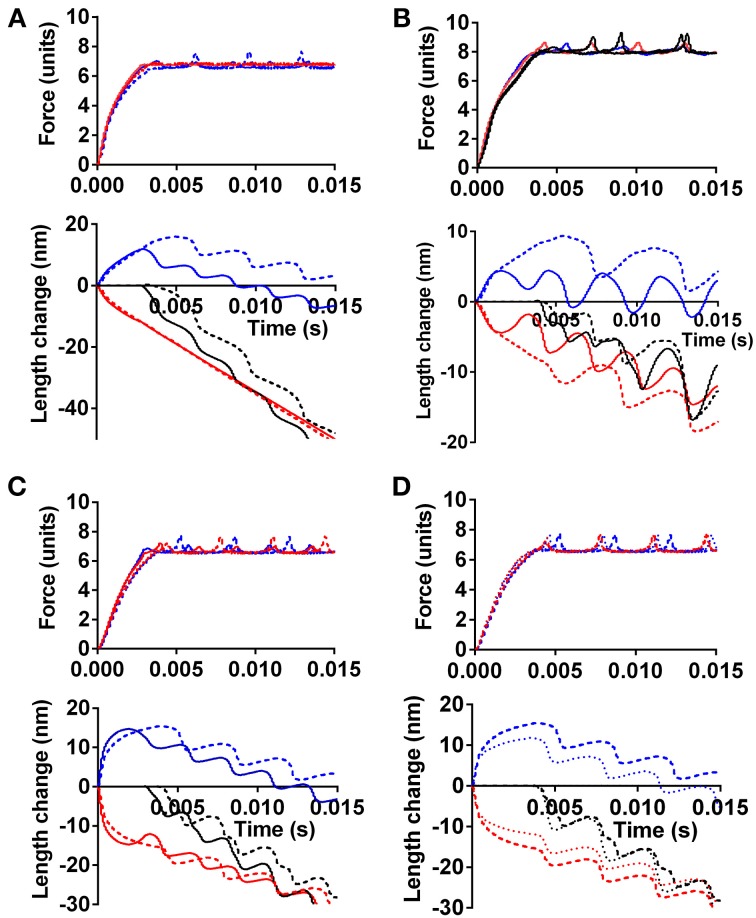
Figure 4.
The effect of different force-generating capacity or calcium sensitivity of two cells in series on simulated tension and length response. (A) Effect of 30% higher maximum tension of one cell. Force clamped to 70% of maximum isometric force of weaker cell. Full lines: Force-velocity curve as black symbols in Figure 3. Dashed lines: Force-velocity curve as red symbols in Figure 3. Blue: response of cell with lowest tension-generating capacity. Red: response of strongest cell. Black in length-time plot: sum of length change for both cells in series. (B) Similar to (A), but only 10% higher maximum tension of one cell and force clamped to 85% of maximum isometric force of weaker cell. Line formats and color codes as in (A). Full calcium activation assumed from onset of simulation. (C) Simulated time course including activation process with higher calcium sensitivity of contractile system in one cell (red) but similar maximum isometric tension in both cells. Line formats as in other panels. (D) Dashed lines, same as dashed lines in (C). Dotted lines, same as in (C) but velocity-dependent increase in attachment rate during stretch as described in text.

