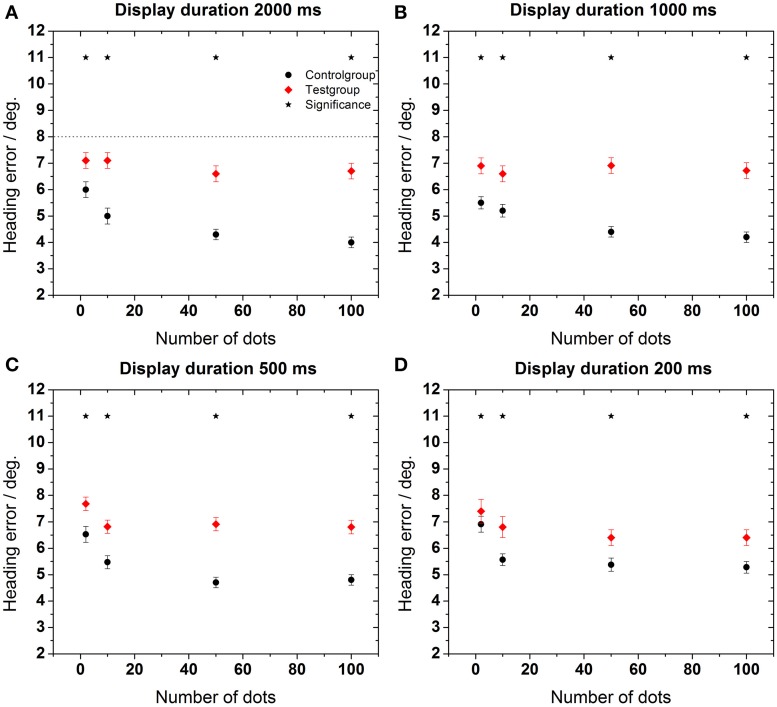
Figure 4.
Heading error as function of the number of dots in the display. Data in each panel were obtained for a specific stimulus duration as indicated on top of each panel (A–D). Error bars show standard error. Asterisks indicate significant differences between data from the control and the test group for a given number of dots in the display (p < 0.02, Mann–Whitney). The dashed line in the upper left panel represents an estimation of the maximum heading error as provided in the Section “Estimation of Maximum Heading Error.”

