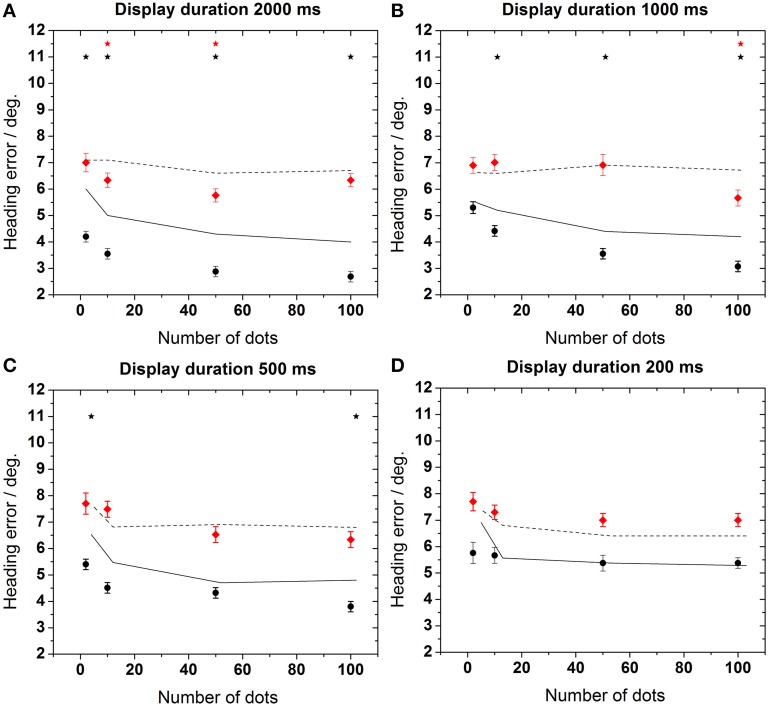
Figure 6.
Heading error as function of the number of dots during stereoscopic stimulation. The solid lines (control group) and dashed lines (test group) depict the results of Figure 4 (non-stereoscopic stimulation) for comparison. Asterisks indicate significant differences between data from non-stereoscopic simulation and stereoscopic simulation of the control group.

