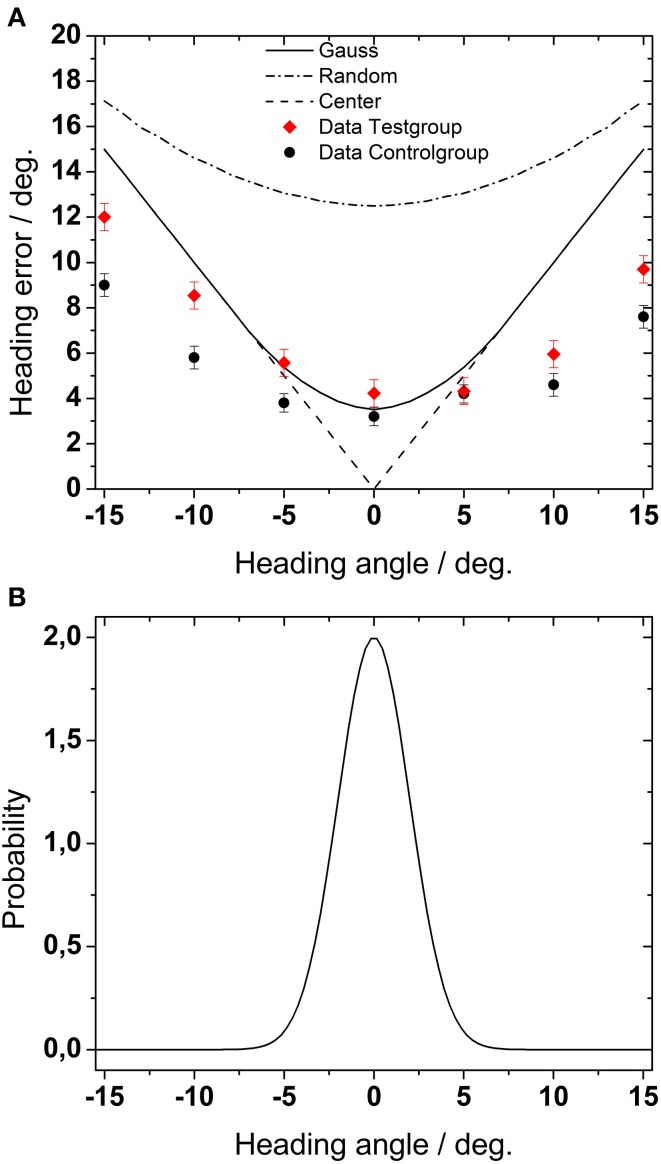
Figure 9.
(A) Estimation of maximum heading error. The dashed-dotted line shows the heading error for purely random behavioral performance, i.e., if heading values were randomly chosen with the same probability. The solid line represents simulated heading error if heading values were chosen according to a Gaussian probability function centered on straight-ahead [as shown in (B), see text for details]. Finally, the dashed line represents simulated heading error for choosing always the center of the screen.

