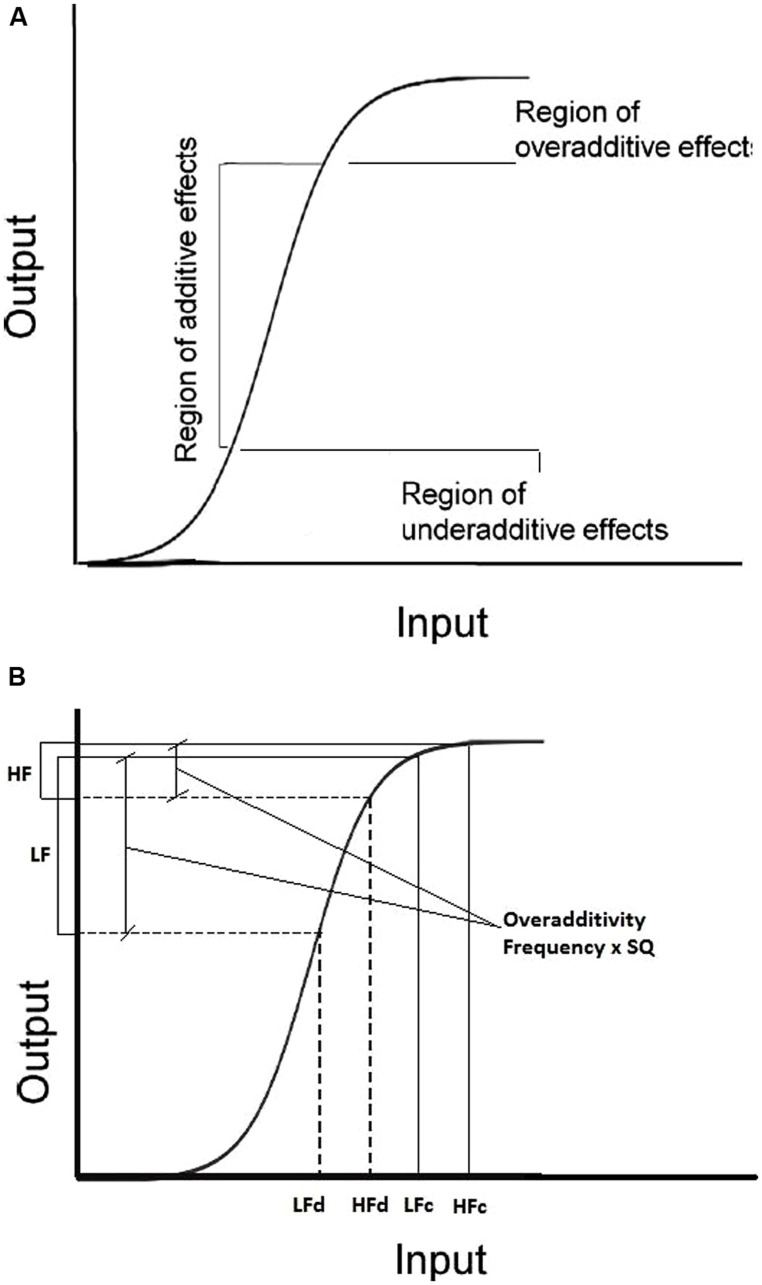
FIGURE 5.
Representation of the Plaut and Booth (2000) input–output activation function. (A) regions of the curve corresponding to underadditive, additive, and overadditive effect. (B) example of application of the function to data from a 2 × 2 factorial design Frequency (High-Low) × Stimulus Quality (SQ: degraded-clear).

