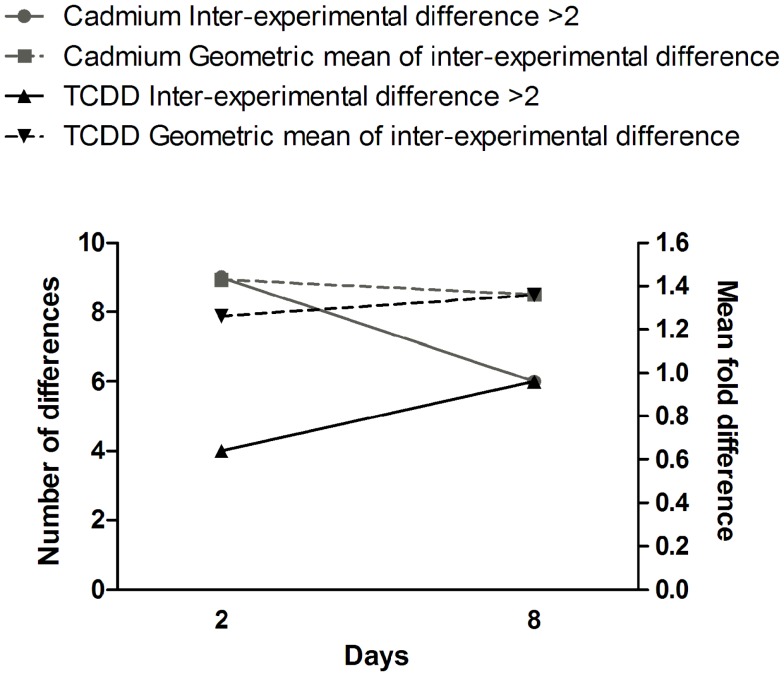
Figure 4.
Time dependence of gene expression differences in cells exposed to cadmium or TCDD. The left y-axis is for the number of differences (≥twofold) between the two experiments (inter-experimental difference). The right y-axis is for geometric mean of fold differences between the two experiments.

