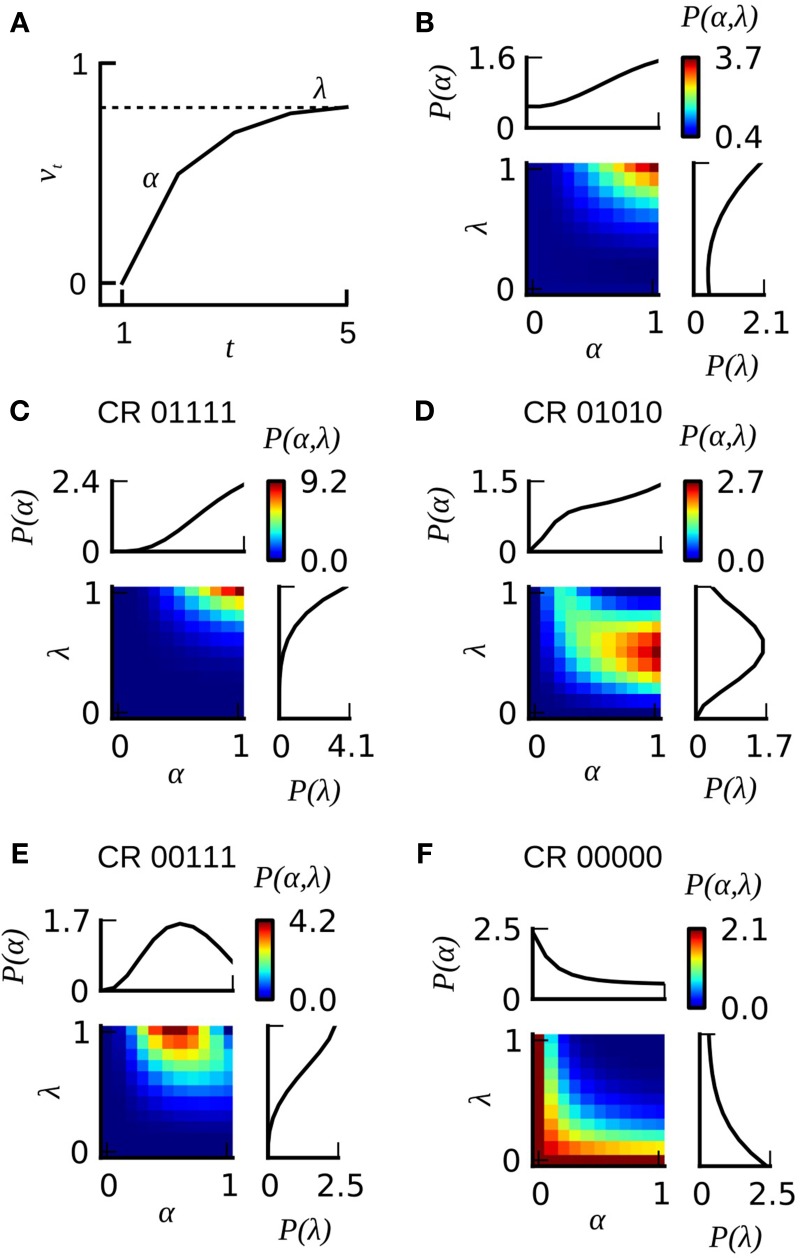
Figure 7.
The extended version of the Rescorla–Wagner model RWP(α, λ). (A) The gradual increase of associative strength vt across training trials in an individual animal is described by two parameters: the rate of learning α and the asymptotic performance level λ. The probability for emitting a CR on a given trial is assumed to equal the associative strength. (B) Color-coded joint distribution P(α, λ) of learning parameters of all animals from dataset 21. Most animals have high learning rates and high learning asymptotes. The inlets on the top and on the right side of the colored joint distribution depict the cumulative probability distributions P(α) and P(λ) for which the joint distribution P(α, λ) has been summed over lambda or alpha, respectively. (C–F) Color-coded likelihoods for observing a particular sequence of CRs given different combinations of α and λ. The leftmost number of the CR sequence equals the CR in the first trial, and the rightmost number in the CR sequence equals the CR in the last trial.

