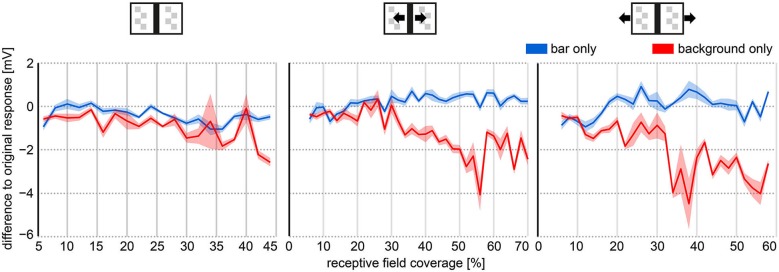
Figure 4.

Object and background effects on HSE responses as a function of the receptive field coverage of the bar. The object and background effects were determined as the response differences between the average response to the modified texture stimulus movies (Figures 2C,E red and blue curve) and the average response to the original stimulus movie (Figures 2C,E; black curve). Receptive field coverage was binned in 2° bins. The response differences were averaged within these bins. Receptive fields of HSE cells were roughly approximated to range from 20° contralaterally to 172° ipsilaterally in azimuth. Right and left HSE responses were pooled. Thick lines represent average response difference, shaded areas represent the SEM.
