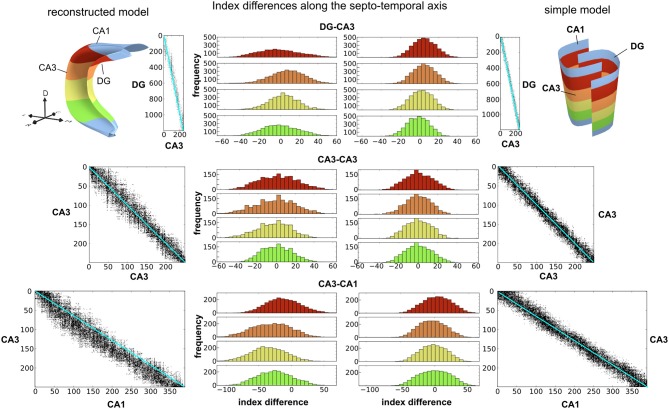
Figure 11.
The Morphology of the neuronal layer has a significant impact on the connectivity between neurons. We compared the reconstructed model based on PAM (top left) to a simple model based on approximate layer morphology (top right). Results for the reconstructed and simple model are shown on the left and right, respectively. For the depiction of the connectivity matrices (scatter plots), neurons in all layers were sorted along the septo-temporal axis. Black dots in the connectivity matrices denote a connection between a pre-synaptic neuron (rows) and a post-synaptic neuron (columns). For the red, orange, yellow and green areas along the septo-temporal axis, histograms of the index differences were computed from the connectivity matrices (shown in the middle). Wider distributions indicate that the projections of a neuron are more scattered along the septo-temporal axis. Since neurons are homogeneously distributed in the layers, region sizes along the septo-temporal axis must change on the proximal-distal axis (see Figure 12 for further explanations).

