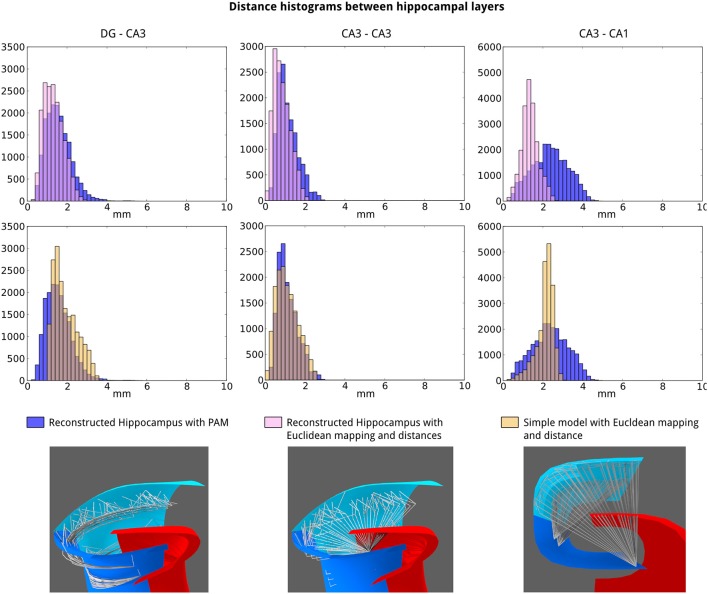
Figure 13.
Connection distances depend significantly on layer morphology and distance calculation model. The distributions of connection distances for DG-CA3 (left), CA3-CA3 (middle), and CA3-CA1 (right) connections are compared for three different scenarios indicated at the lower part of the figure. The model was either the reconstructed model or the simple model. The distance calculations were either based on the PAM techniques or on the Euclidean distance.

