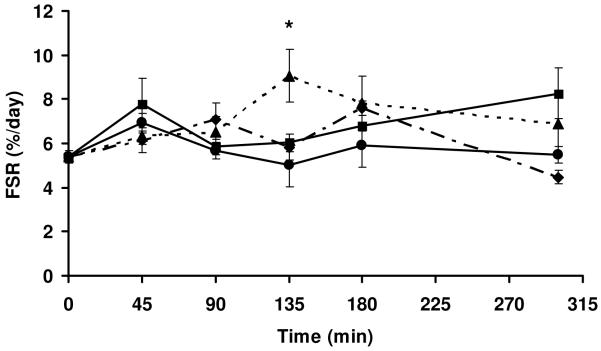
Figure 1.
Time course changes in the FSR of gastrocnemuis of muscles of rats fed either a 4-gram meal containing 20% energy from either whey protein isolate ( ), soy protein isolate (
 ), Blend 1 (
 ) or Blend 2 (
 ). Data are means ± SEM; n=5-6 animals/time point. *P<0.05, Blend 2 vs WP at 135 min. Where there are no symbols, there is no significant difference between any groups at any given time point. Only the 135 min time point for Blend 2 and the 180 min for Blend 1 FSR were significantly different versus base line min (P<0.05). The FSR at 135 min for Blend 2 was also significantly higher than the corresponding FSR for the other protein groups at this time point (p<0.05).

