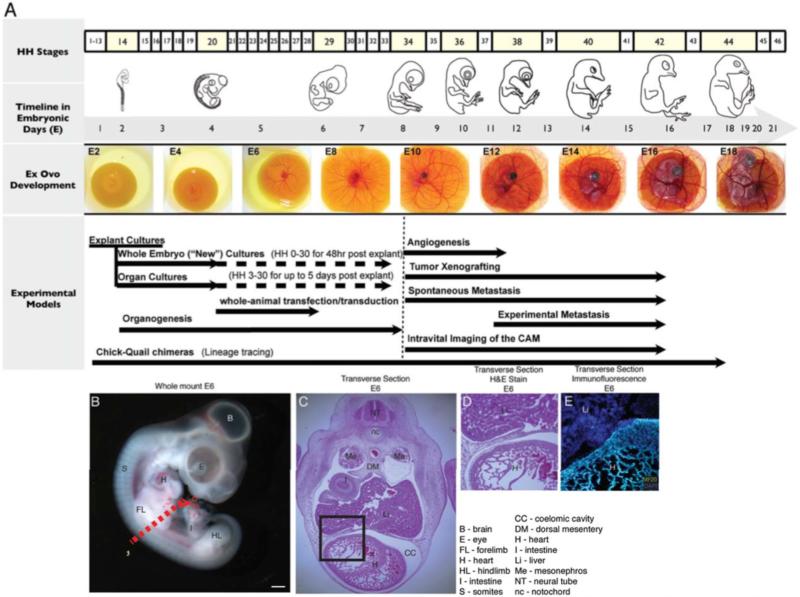
Figure 1. A) Chick embryo staging and the experimental timeline.
A developmental timeline of the chick embryo in days is matched with the Hamburger-Hamilton stages using selected images (Hamburger and Hamilton, 1951) and time-matched images from ex ovo culture. Common experimental models are matched to the time line shown at the top. B) Whole mount of E6 embryo. Dotted line indicates approximate transected views shown in C-E. C) H&E staining of transverse section taken from E6 embryo. Developing structures in heart (D) were visualized using immunofluorescent staining with matching H&E staining (E) respectively.

