FIG. 9.
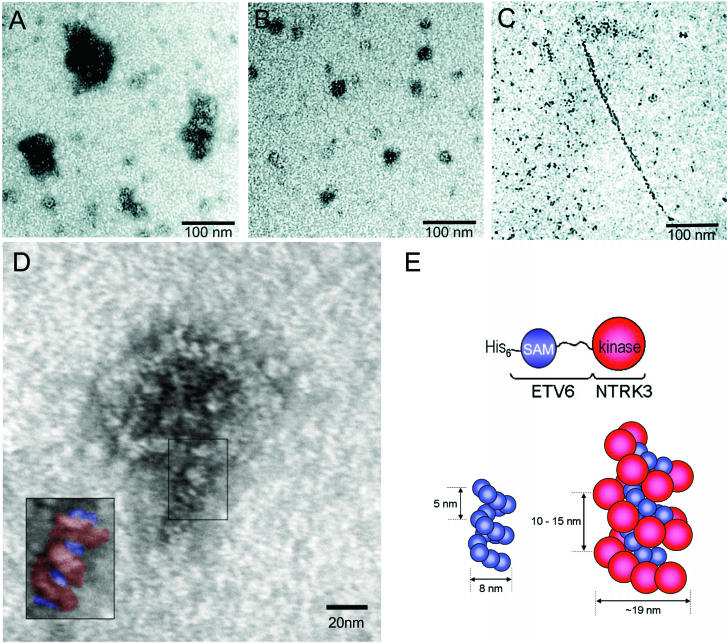
EM of the ETV6 and EN polymers. Proteins were spotted onto grids and visualized by transmission EM after negative staining with uranyl acetate. (A) His-EN-WT formed large globular structures. (B) The His-EN-WT complexes were reduced in size upon addition of 10 M equivalents of the isolated A93D SAM domains. (C) For comparison, the isolated A93D SAM domains can form a polymeric filament when the pH is reduced to 6.0. (D) Higher-magnification scan of WT EN protein. The boxed insert highlights the repeating helical pattern. (E) Schematic model of the WT EN polymer. ETV6 SAM domains are diagrammed in blue, and NTRK3 kinase domains are diagrammed in red. Representations of both WT ETV6 and WT EN polymers, consistent with the EM data, are shown for size comparison.

