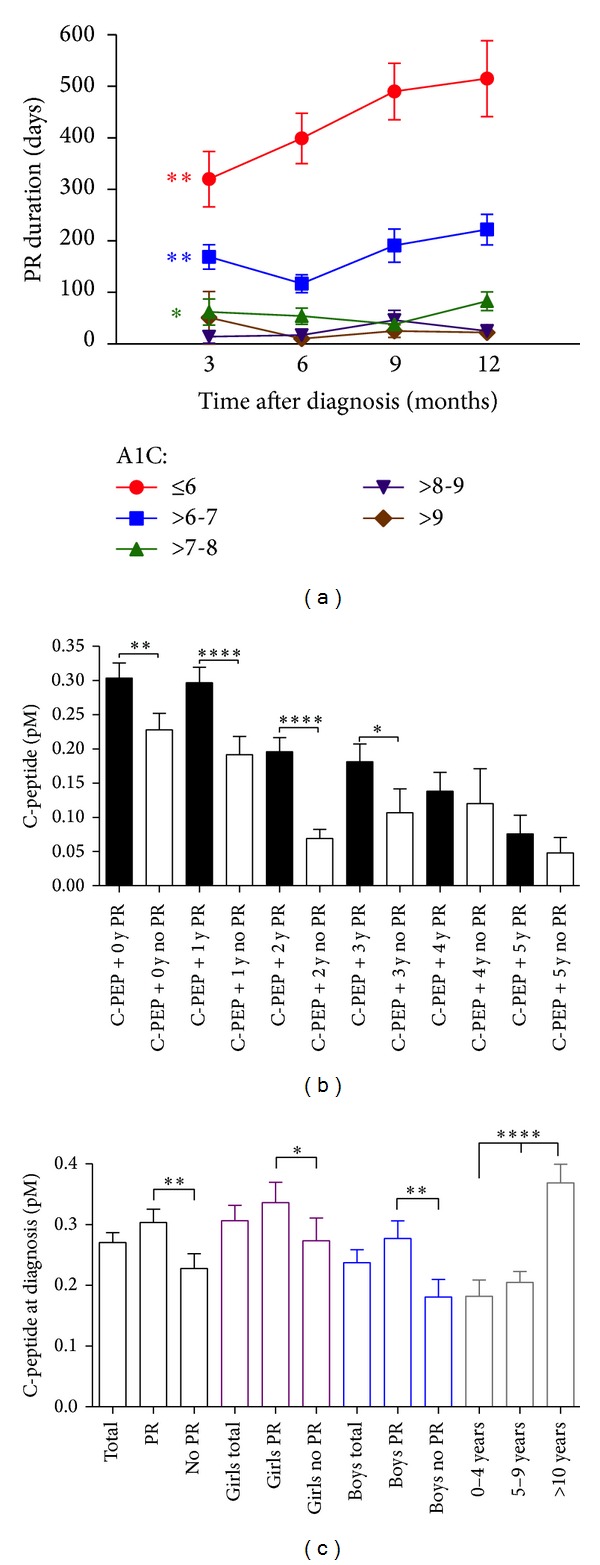
Figure 2.

Influence of early A1C levels on PR duration and characteristics of C-peptide levels among PR, age, and gender subgroups. (a) Graph showing negative correlation between A1C levels (subgroups indicated) at 3-, 6-, 9-, and 12-month follow-up and PR duration. (b) C-peptide levels were higher in patients entering PR when evaluated at diagnosis and after 1, 2, and 3 years. (c) Differences in C-peptide levels among PR, gender, and age subgroups. All bars were shown with SEM. *P < 0.05, **P < 0.01, and ****P < 0.0001 compared with indicated groups.
