
Figure 4.
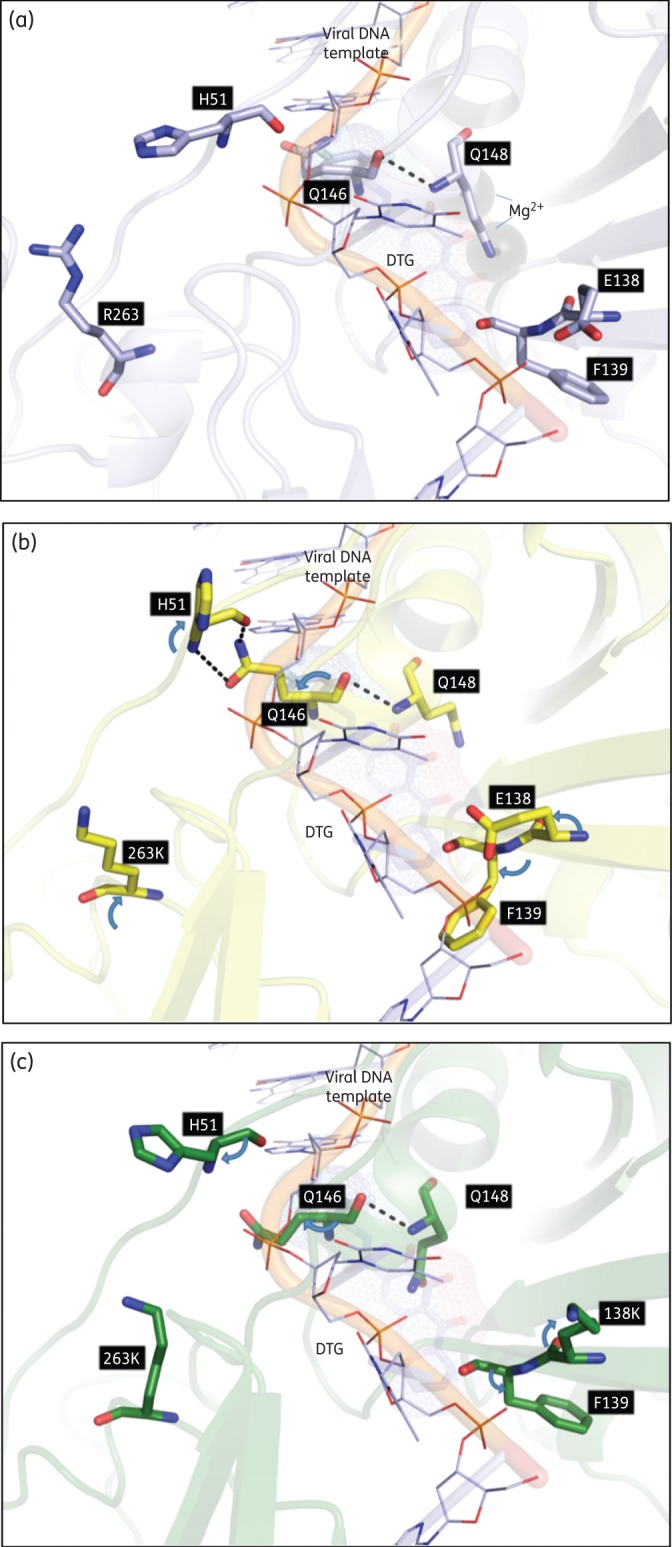
Visualization of putative interactions between HIV residues at positions 263 and 138. (a) WT model (light blue). (b) The R263K model showing altered orientations (blue arrows) and interactions with WT residues. (c) The E138K/R263K model showing an altered orientation from the R263K mutation alone (blue arrows). Key residues are labelled and shown as stick structures with standard atomic coloration. DTG, dolutegravir. This figure appears in colour in the online version of JAC and in black and white in the print version of JAC.