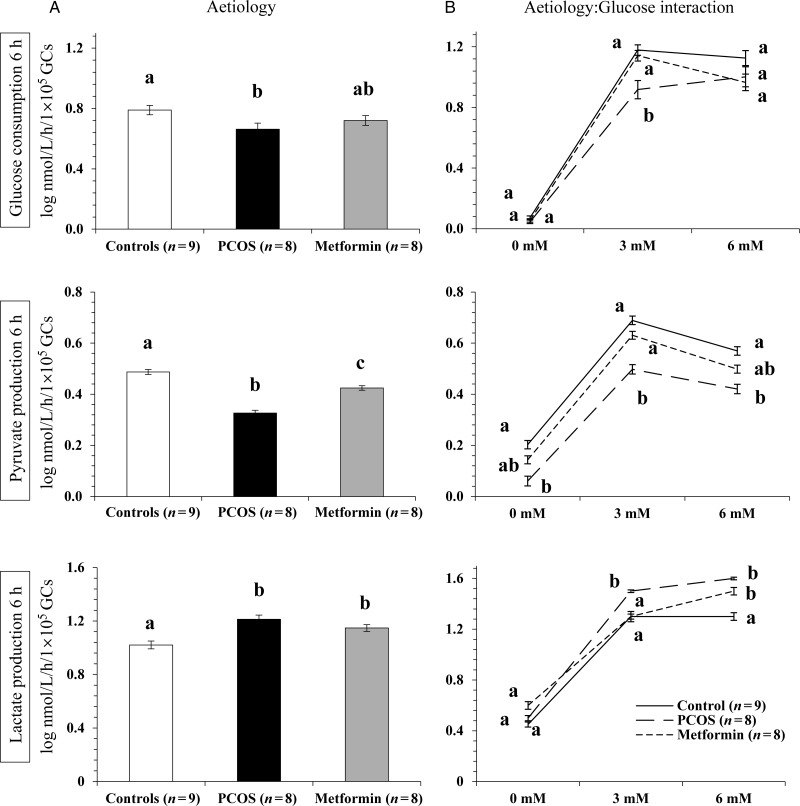
Figure 1.
The effect of aetiology (A) and aetiology-glucose interaction (B) on acute glucose consumption, pyruvate and lactate production by granulosa cells (GCs) at 6 h of culture. Values plotted are mean ± SEM of the log-transformed data for the number of individual patient cultures shown. Data have been standardized according to viable cell number plated. Different letters on graphs in (A) indicate significant differences between the three aetiological groups tested for each metabolite (P < 0.05). Different letters on graphs in (B) indicate significant differences (P < 0.05) between the three aetiological groups within each glucose dose.

