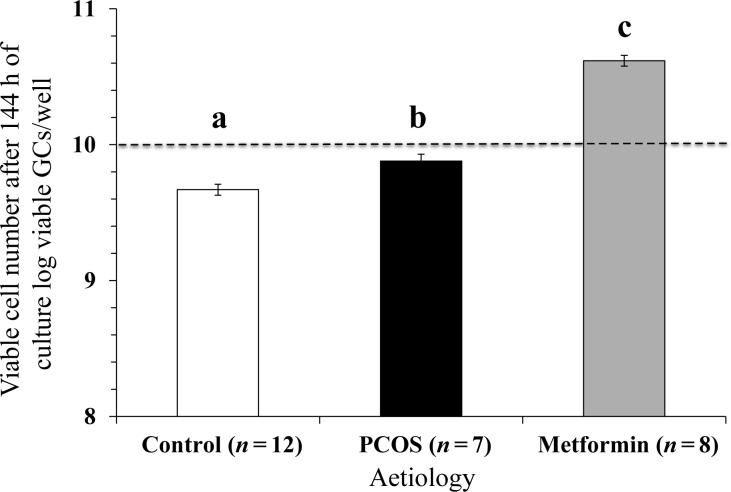
Figure 2.
The effect of aetiology on GC viability after 144 h of culture. The values plotted are mean ± SEM of the log-transformed data for the number of individual patient cultures shown. Different letters on the graph indicate significant differences (P < 0.05) between the aetiologies. The dotted line represents the plating density of viable cells per well at the start of the culture.

