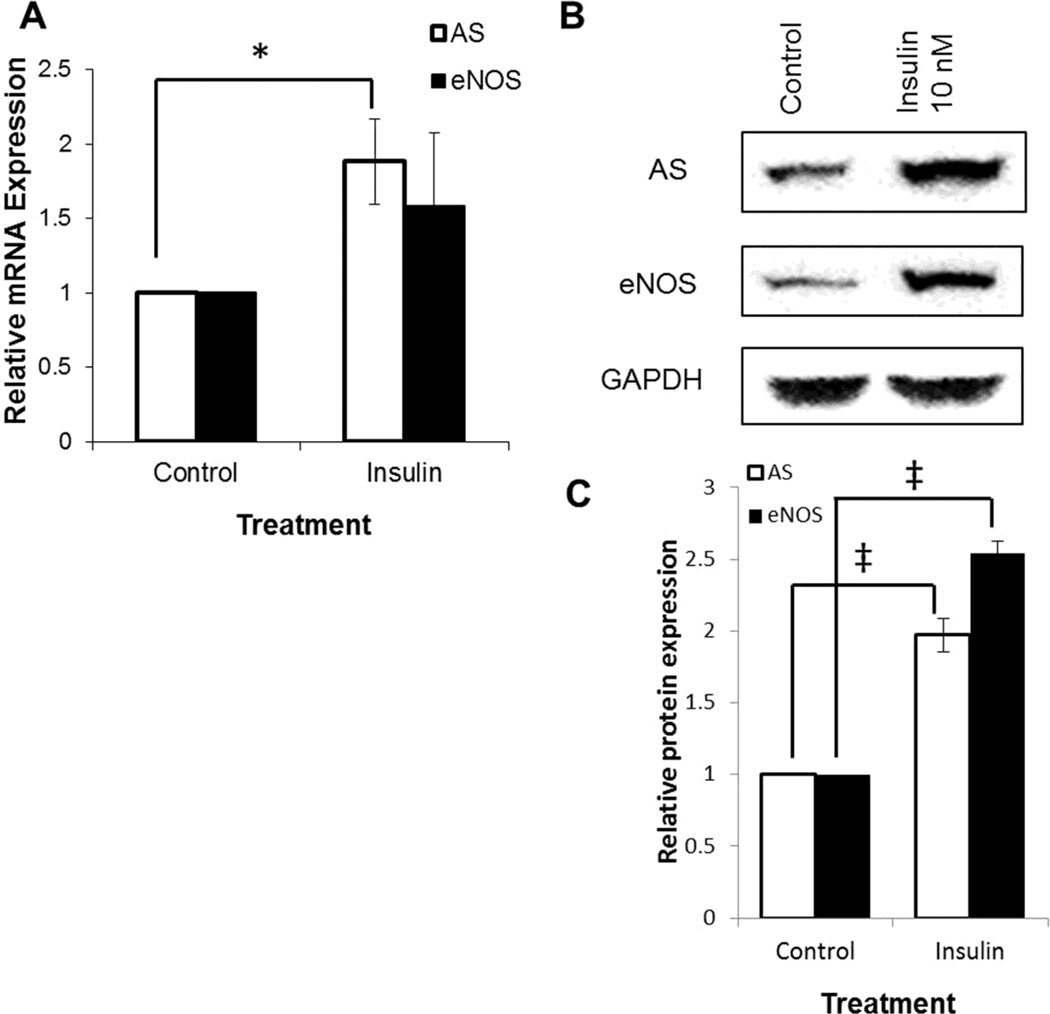
Fig. 1.
Quantitation of eNOS and AS expression in cultured cells by qRT-PCR and western blotting. Confluent BAEC were serum starved for 16 hr and treated with 10 nM insulin for 2 hours. Control cells were untreated. (A) Total RNA, isolated from treated and control BAEC, was reverse transcribed and AS and eNOS mRNA levels were measured relative to GAPDH by qRT-PCR. (B) BAEC were lysed with RIPA buffer, equal amounts of protein were separated by SDS PAGE, and standard western blotting was performed using anti-AS, anti-eNOS, and anti- GAPDH antibodies. (C) Quantitation of the western blots relative to GAPDH expression respectively. (* p < 0.05, ‡p < 0.01)

