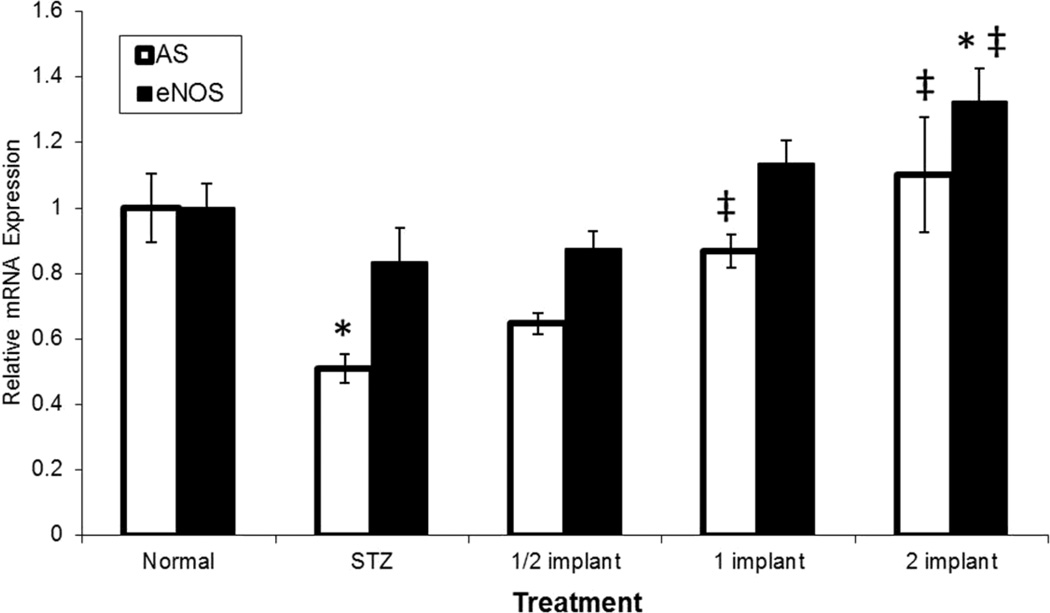
Fig. 3.
Quantitation of eNOS and AS mRNA expression in STZ-induced diabetic rats by qRT-PCR. STZ-induced diabetic rats were compared to normal rats relative to insulin induced expression of AS and eNOS. Diabetic rats were randomly divided into four groups (n=4 per group). Three groups of diabetic rats had slow-release insulin pellets implanted under the dorsal skin of the neck at a dosage of 25% normal insulin (1/2 implant), 50% normal insulin (1 implant), and 100% normal insulin (2 implant) for 21 days. One group of diabetic rats received no implant (STZ). Non-diabetic (Normal) animals also received no implant. Total CEC RNA was reverse transcribed and AS and eNOS mRNA levels were quantitated relative to ribosomal protein, large P2 (RPLP2). (*p < 0.05 compared to control, ‡p < 0.05 compared to STZ alone)

