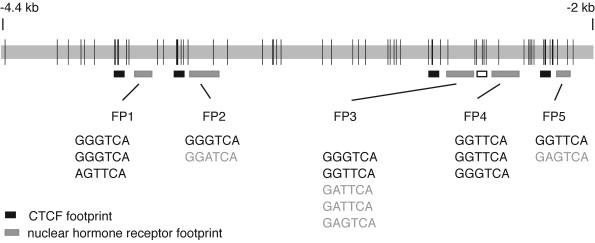
FIG. 3.
Schematic representation of the location of in vivo footprints across the 2.4-kb H19-Igf2 ICR sequence. In vivo footprints identified by LMPCR analysis of the ICR sequence are indicated by boxes. Black boxes mark the location of the four in vivo CTCF footprints (34). Gray-shaded boxes indicate the positions of the newly identified NHR-like footprints (FP1, FP2, FP3, FP4, and FP5) found 30 to 45 bases 3′ to each CTCF footprint. The open box next to FP4 delineates the position of a degenerate CTCF site. NHR half sites found within the DNase I footprinted areas are shown below each respective footprint. PuGGTCA or PuGTTCA sites are shown with black characters; less-stringent half binding sites are shown in light-grey characters. Vertical lines mark the positions of CpG dinucleotides along the ICR.

