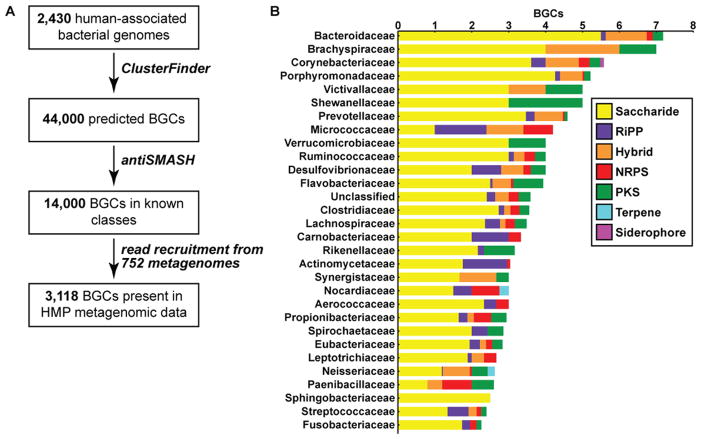
Figure 1. Overview of BGCs in the human microbiome.
A) Computational and experimental workflow for the identification of BGCs from human-associated bacteria. B) A bar graph showing the top 30 families by average BGC abundance from the human microbiome, and the average number and type of BGCs discovered in isolates of each genus using the workflow in A. See also Figure S1 and Supplemental Data File 1 for the full data set of predicted BGCs.

