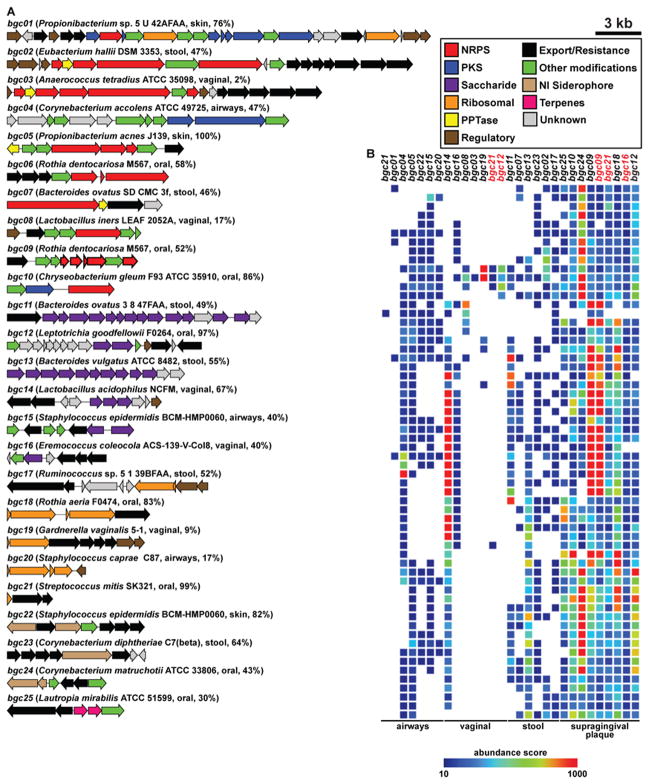
Figure 2. A selected subset of BGCs from the human microbiota.
A) 25 selected BGCs from the human microbiota, spanning each of the body sites (gut, vagina, airways and skin, and oral cavity), BGC types (PKS, NRPS, RiPPs, terpenes, NI siderophores and saccharides) and prevalent bacterial phyla (Actinobacteria, Bacteroidetes, Firmicutes, and Proteobacteria). The label of each gene cluster indicates its source organism, body site of origin, and the percentage of HMP samples harboring this cluster in its body site of origin. All but two of these BGCs are present in more than 10% of the samples from their body site of origin, indicating that they are widely distributed among healthy subjects. B) Heat map showing the representation of BGCs from A in a subset of 60 selected HMP metagenomic samples from four body sites. The color of the cells in the heat map represents an abundance score ranging from 10 (blue) to 1000 (red) (key shown to the right, see Extended Experimental Procedures for calculation of abundance scores, and see also Figure S2 and Table S1).

