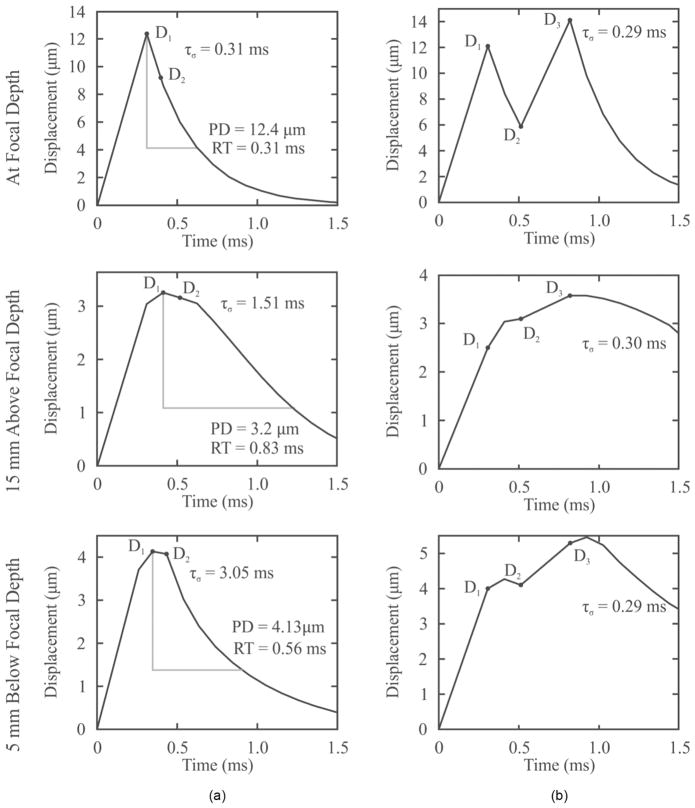
Fig. 4.
Representative (a) ARFI and single-push VisR and (b) double-push VisR one-dimensional axial displacement profiles measured in a homogeneous tissue mimicking phantom at the focal depth, 15 mm above and 5 mm below the focal depth. For each depth, ARFI peak displacement (PD) and recovery time (RT) measures (column a), single-push VisR D1a and D2a measures with associated τσ values (column a), and double-push VisR D1, D2, and D3 measures with associated τσ values (column b) are shown. Although ARFI PD and RT and single-push VisR τσ values vary with depth, double-push VisR τσ values are more consistent.

