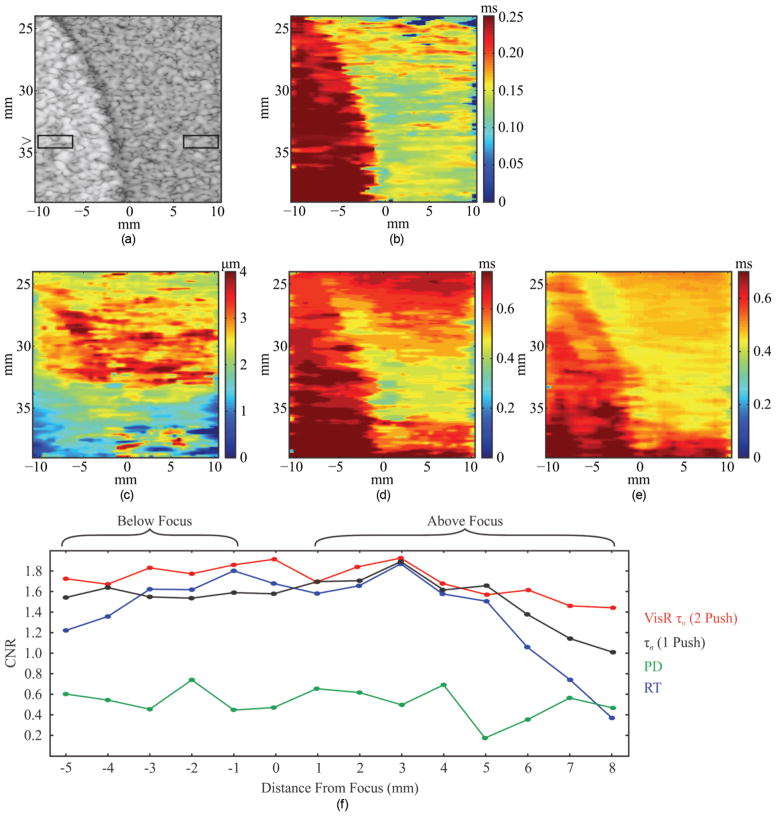
Fig. 6.
(a) B-mode, (b) double-push VisR τσ, (c) ARFI peak displacement (PD), (d) ARFI recovery time (RT), and (e) single-push VisR τσ images of a tissue-mimicking phantom with a spherical inclusion that is comparably stiff but more viscous than the background. The boxes in the B-mode image represent the 3 mm laterally by 1 mm axially ROIs used to calculate contrast-to-noise ratio (CNR). (f) CNR is plotted versus distance from the focus for the double-push VisR τσ (red), ARFI PD (green), RT (blue) images, and single-push VisR τσ (black).

