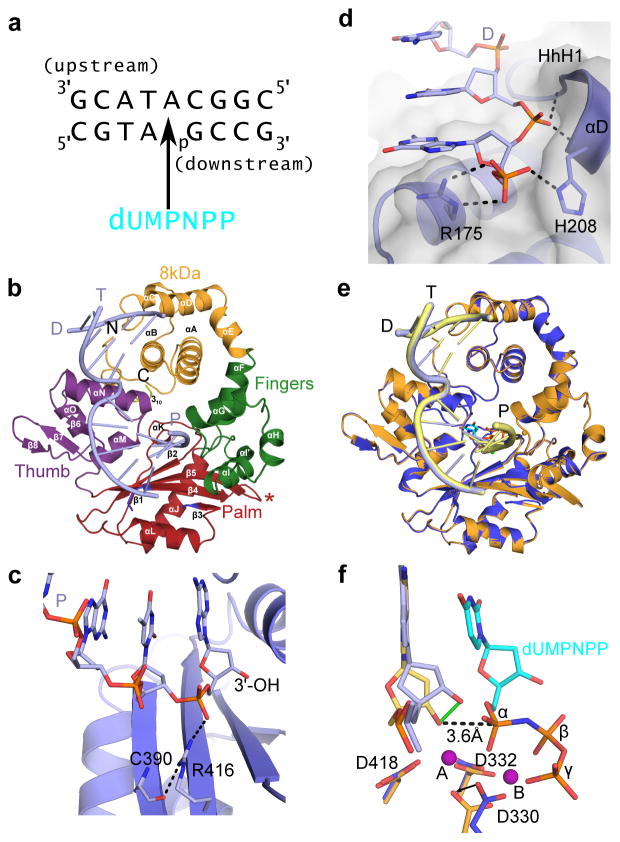
Figure 1. Structural features of the hPol μ Δ2 binary and pre-catalytic ternary complexes.
(a) Single-nucleotide gapped DNA substrate used for co-crystallization with hPol μ Δ2. (b) Ribbon diagram of the hPol μ Δ2 binary complex with substrate from (a), displaying the individual domains structures (8 kDa, fingers, palm, and thumb domains are shown in orange, green, red, and purple, respectively). Loop 1 is drawn in blue, and the truncated Loop 2 is indicated by a red asterisk. α-helices are labeled alphabetically, and β-strands numerically. The template (T), upstream primer (P), and downstream primer (D) strands are also labeled. (c) Hydrogen bonding network stabilizing the position of the primer terminus (light blue, with 3′-OH marked) in the hPol μ Δ2 binary complex (blue). (d) Binding of the 5′-phosphate on the downstream end of the gapped DNA substrate. Putative hydrogen bonding interactions between the hPol μ Δ2 8kDa subdomain (blue sticks) and the 5′-phosphorylated downstream primer (D). (e) Structural superposition of the hPol μ Δ2 binary (blue, DNA in light blue) and pre-catalytic ternary complexes (orange, DNA in yellow). (f) Superposition of the catalytic centers of the binary and ternary complexes (colored as in e). Movement of the primer terminal 3′-OH upon binding of the incoming nucleotide is shown as a solid green line. The distance between the primer terminal 3′-OH and the α-phosphate is shown as a dashed line. Mg2+ ions are shown as purple spheres. All structural figures were generated using PyMOL (Schrödinger, http://www.pymol.org).

