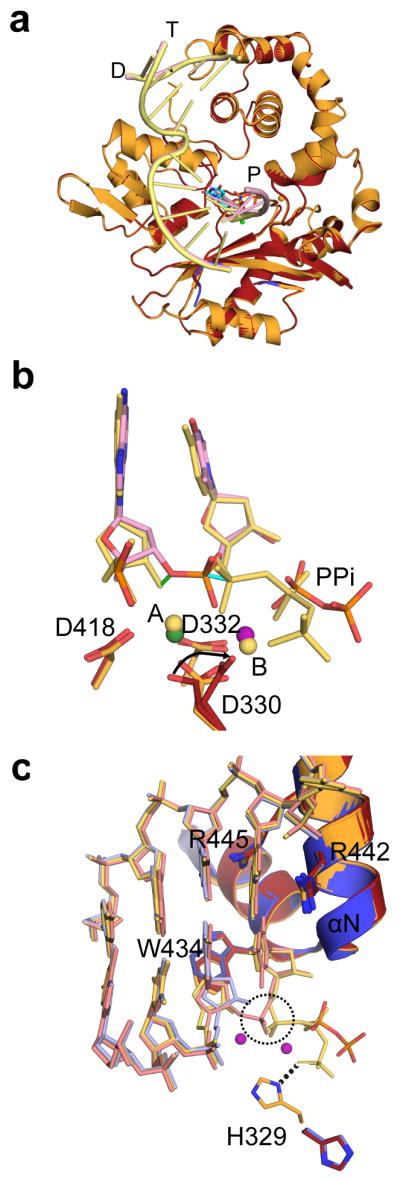
Figure 2. Structural characterization of the nucleotide incorporation by hPol μ Δ2.

(a) Structural superposition of the hPol μ Δ2 pre-catalytic ternary (orange, DNA in yellow) and nicked (red, DNA in pink). (b) Superposition of the primer terminal and incoming nucleotides from the pre-catalytic hPol μ Δ2 ternary complex (yellow) with the newly incorporated base from the post-catalytic complex (pink). Movement of the primer terminal 3′-OH and the α-phosphates are indicated by green and cyan solid lines, respectively. Divalent metals from the ternary complex are shown as yellow spheres, while those from the post-catalytic complex are shown in green (Mn2+) and purple (Mg2+). (c) Superposition of the active centers of the binary (blue, DNA in light blue), pre-catalytic ternary (orange, DNA in yellow) and post-catalytic nicked (red, DNA in pink) complexes of hPol μ Δ2. Incorporation of the incoming nucleotide leads to inversion of the α-phosphate (dashed circle) and release of inorganic pyrophosphate.
