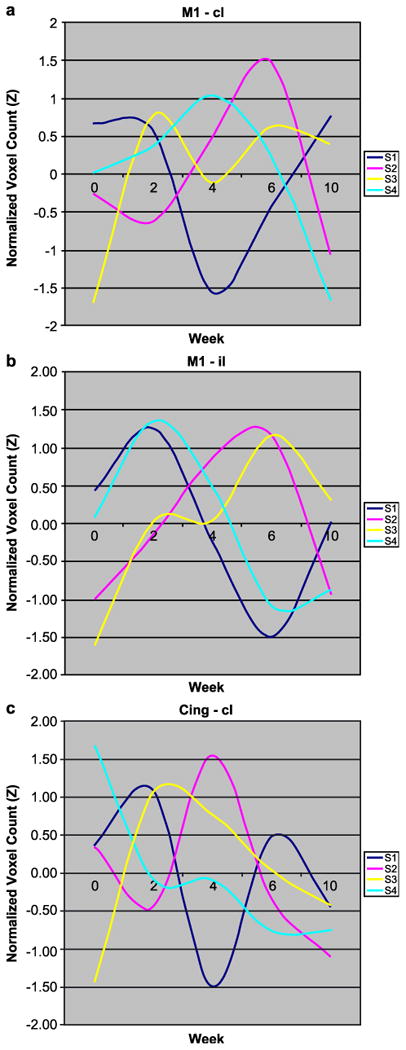
Fig. 4.

The number of voxels activated (Z > 2.3, P = 0.01) within the manually drawn regions of interest for each subject in Fig. 3 were tabulated and normalized at baseline for follow-up at 2, 4, 6, and 10 weeks of rehabilitation for walking. M1 (contralateral, cl) to the paretic foot (a) and ipsilateral (il) (b) consistently showed a rise, followed by a decline in activated voxels as behavioral gains progressed for the Subjects 2, 3, and 4 with subcortical strokes. A similar rise followed by a decline was evident in cingulate motor area cl (c). Subject 1, who had a frontal infarct, had a pattern of decreasing activation. The responses in supplementary motor areas changed little over time.
