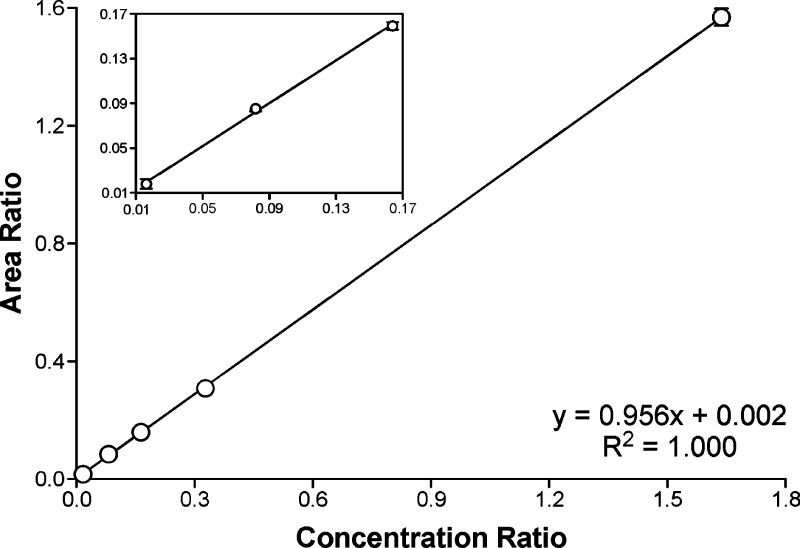
Figure 3.
Calibration curve for the quantitation of [D4]6 by LC-ESI-MS/MS. The amount of [13C6]6 (internal standard) was maintained at 51.1 pmol on column, while the amount of [D4]6 ranged from 0.84 fmol to 84 fmol on column. The X axis plots the concentration ratio of [D4]6 to [13C6]6. The Y axis plots the peak area ratio from the corresponding transitions, m/z 298 → m/z 182 and m/z 300 → m/z 184. Each data point represents the average of six measurements performed on different days with the error bars indicating standard deviation.

