Abstract
Background/Aims
To investigate the differential expression of RING finger (RNF) proteins in Barrett esophagus (BE) and esophageal adenocarcinoma (EAC).
Methods
The differential expression of RNFs in normal esophagus (NE), BE, and EAC was screened using microarray assay. Real-time quantitative polymerase chain reaction (PCR), tissue micro-array assay, and Western blot analysis were independently performed to detect the mRNA and protein expression of screened RNFs.
Results
The expression of nine RNFs in the BE or EAC was 2-fold higher than those in NE. Among these proteins, the RNF32 and RNF121 expression in BE was 20.3-fold and 16.4-fold higher, respectively, than that in NE, and the expression of RNF24, RNF130, RNF141, RNF139, RNF11, RNF14, and RNF159 was upregulated more than 2-fold compared with NE. The expression of nine RNFs was not only upregulated in the EAC but was also positively related to the RNF expression in BE. The PCR results also indicated increased expression of these RNFs in BE and EAC compared to NE. Furthermore, the mRNA expression of all RNFs, except for RNF141 in EAC, was dramatically higher than those in the BE. Similar results were also obtained from the Western blot analysis.
Conclusions
A total of nine RNFs play critical roles in the progression of BE to EAC.
Keywords: Barrett esophagus, Esophageal adenocarcinoma, RING finger proteins, Tissue array analysis
INTRODUCTION
Barrett esophagus (BE) refers to an abnormal change (metaplasia) in the cells of the inferior portion of the esophagus: the normal stratified squamous epithelium is replaced by metaplastic columnar epithelium with or without intestinal metaplasia. Currently, BE with intestinal metaplasia has been referred to as a precancerous lesion of esophageal adenocarcinoma (EAC).1 Studies have confirmed BE is closely related to the occurrence of EAC, and more than 80% of EAC derive from BE.2,3 With the rapid development in the modern biotechnology, increasing basic and clinical studies have been conducted to investigate the BE, but the exact molecular mechanism of BE is still poorly understood. A RING finger (RNF) protein is a type of zinc finger protein containing ring finger motif and can bind E3 ubiquitination enzymes and their substrates and hence function as ligase promoting the degradation of target proteins.4 Studies have indicated RNFs play an important role in the regulation of cell differentiation, growth and transformation, and abnormal expressions of RNFs can result in certain pathological sequences including cancers.5 We hypothesized that RNFs maybe play some roles in the progression of BE to EAC. To certificate the hypothesis in the present study, microarray assay was performed to screen RNFs in BE and EAC, and the mRNA and protein expressions of these RNFs were determined by polymerase chain reaction (PCR), Western blot, and tissue microarray (TMA) assay, respectively.
MATERIALS AND METHODS
1. Sample collection
Thirty patients with BE (age from 45 to 73 years; 18 males, 12 females), 30 patients with EAC (age from 43 to 78 years; 17 males, 13 females), and 30 patients with normal esophagus (NE) (age from 42 to 76 years; 18 males, 12 females) were recruited from the Gastrointestinal Endoscopy Center of Southwest Hospital. The age and the sex in the three groups was not obvious different (p>0.05). Informed consent was obtained before study. The NE tissues, BE tissues, and EAC tissues were collected and stored at liquid nitrogen and then −80°C. The tissue size was about 4 mm and conventional H&E staining was performed for all tissues.
2. Extraction of RNA
The tissues were grinded in liquid nitrogen and total RNA was extracted with Trizol (Invitrogen, Carlsbad, CA, USA). The integrity and purity of extracted RNA were determined through 1.2% methanol agarose gel electrophoresis. The purity of RNA (OD260/OD280) was greater than 1.8 and microarray assay was performed.
3. cRNA synthesis, fluorescent labeling, and purification
The cRNA synthesis system included 5×first chain buffer 4 μL, 0.1 mol/L dithiothreitol (DTT) 2 μL, 10 nmol/L deoxy-ribo-nucleoside triphosphate mix 1 μL, murine leukemia virus retroviridase 1 μL, and RNA enzyme-free water 0.5 μL, with a total volume of 8.5 μL. The above mixture was mixed with denatured RNA enzyme in ice bath, and preserved at 40°C for 2 hours. After cRNA synthesis, the centrifuge tube was incubated at 65°C for 15 minutes (50% polyethylene glycol was incubated at 40°C for 1 minute before use), and the Cy3/Cy5 2.4 μL was added and mixed. Transcription reaction system was prepared as follows. RNA enzyme-free water l5.3 μL, 4×transcription buffer 20 μL, 0.1 mol/L DTT 6 uL, NTP 8 μL, 50% polyethylene glycol 6.4 μL, RNA enzyme-free water 0.5 μL, inorganic pyrophosphatase 0.6 μL, and T7 RNA polymerase 0.8 μL, with a total volume of 57.6 μL. The above mixture was mixed and then incubated at 40°C for 2 hours. The purification of fluorescent probes was performed according to the instruction of QIAGEN Rneasy Mini Kit (QIAGEN, Valencia, CA, USA). After probe labeling, RNA enzyme-free water 20 μL and buffer RLT 350 μL was added and mixed, and then absolute ethanol 250 μL was added and mixed. A total of 700 μL total RNA solution was transported to RNeasy columns in 2 mL centrifuge tubes and then centrifugated at ≥8,000 g for 15 seconds, and filtration solution was discarded. Subsequently, 500 μL buffer RPE was added and centrifugated at ≥8,000 g for 2 minutes, and then filtration solution and the intubation tube were removed and the RNeasy mini column was inserted into a 1.5 mL Eppendorf tube. A 30 μL RNA enzyme-free water was added and centrifugated at ≥8,000 g for 1 minute, and then 20 μL RNA enzyme-free water was added and centrifugated at ≥8,000 g for 1 minute once again.
4. Microarray hybridization
cRNA gragmentation reaction system included Cy3-cRNA 1 μg, Cy5-cRNA 1 μg, 10×control targets 50 μL, and RNA enzyme-free water was added to a total volume of 240 μL, and gragmentation buffer l0 μL was added and then gently mixed and incubated at 60°C for 30 minutes. Subsequently, 250 μL of hybridization buffer was added and then gently mixed. Hybridization solution was dropped to a cover glass, and then was covered with microarray, and the microarray was sealed in a hybridization box and hybridized at 60°C for 16 hours. Microarray was performed at room temperature. Washing solution 1 was prepared with ddH20 700 mL, 20×saline sodium phosphate EDTA 300 mL, and 20% N-lauroyl methylglycine 0.25 mL; and washing solution 2 was prepared with ddH20 997 mL, 20×SSPE 3.0 mL, and 20% N-lauroyl methylglycine 0.25 mL; and washing solution 3 was stable drying liquid. Microarray was washed with washing solution 1, 2, and 3 for 1 minute, 1 minute, and 30 seconds, respectively.
5. Microarray data analysis
After hybridization, the picture of the microarray was obtained by an Agilent scanner (Agilent, Palo Alto, CA, USA), and then quantitative analyses and processing were performed with the system’s feature extraction software. After the parameters including fluorescence, background, and standardization mode were set, image quantification and standardization processing of data was directly performed. Efferent data package included fluorescence signal, background signal, normalized fluorescence signal and LogRatio values (the logarithm value of ratio of Cy3 and Cy5 fluorescence) and other parameters. It was generally recognized that there was no significant differential expression in genes with Ratio values between 0.5 to 2.0, otherwise there was significantly differential expression in genes with Ratio values beyond the above limits.
6. Real-time reverse transcription (RT)-PCR
The RNF genes with differential expressions were selected for RT-PCR and primers were synthesized in Shanghai Sagon Biotech (Sagon, Shanghai, China) (Table 1). Glyceraldehyde 3-phosphate dehydrogenase (GAPDH) was used as the internal reference. RT-PCR was performed according to manufacture’s instruction and a total of 45 cycles were conducted. The Ct values and original relative concentration (C) were obtained and analysis was performed with software (ABI Prism 7000 SDS; Applied Biosystems, Foster City, CA, USA). Based on the specific value of original relative concentration, the average and standard deviation were calculated.
Table 1.
The RING Finger Primers for Polymerase Chain Reaction
| Gene | Primer F | Primer R |
|---|---|---|
| RNF32 | GTTGTATGTGCCAT-CAAGG | GCCCTAATAAGCCAAAAGAT-GA |
| RNF139 | AGGGAGGACGATGCGG | GCAGGAAGCCGCCATCTC |
| RNF130 | TGGCCCTGCTGACTTG-CAGC | CATGCTTGCAGGGGAGAACCC |
| RNF24 | TGAGTTGGGGATTTGTC-CAT | TACTTTGCGAACTTCCAGCC |
| RNF11 | ACCGTGGTGAGACCTA-ATGA | GAGGCAAGGAGGTCAGAAGA |
| RNF141 | AGCACGTCACCTTGGTTC-GAG | AATTCATGATCCGCGATGCTTC |
| RNF14 | CTGTCCAAGGTGGAGA-AACC | AAGTGGAGGCAGAAAGCAAA |
| RNF121 | CATCGT-GGGAAAGAAGCAA | CGAAGCCAGTCCAGCAGTT |
| RNF159 | ATTAGGAGCGATC-CAAGTGC | AACTGCAACACCACAAGGAC |
| GAPDH | GGTGAAGGTCGGAGT-CAACG | CCATGTAGTTGAGGTCAAT-GAAG |
RNF, RING finger; GAPDH, glyceraldehyde 3-phosphate dehydrogenase.
7. TMA assay
1) Preparation of TMA assay
The TMA was prepared by Shanghai Biochip Co., Ltd. (Shanghai, China) and Shanghai Outdo Biotech Co., Ltd. (Shanghai, China). Tissues were embedded in paraffin and cut into sections followed by H&E staining. A second pathological diagnosis was performed by pathologists and typical pathological features were marked. A TMA instrument (Beecher Instruments Inc., Silver Spring, MD, USA) was used to produce separate tissue cores (110 mm in diameter) assembled in array fashion to allow multiplex histological analysis. According to the regions of interest in paraffin-embedded tissues (H&E staining). These tissue cores are then inserted in a recipient paraffin block in a precisely spaced, array pattern. The tissues were numbered and two tissue blocks were prepared (72 cores and 104 cores). Sections (4 μm) from this block are cut using a microtome (Leica, Solms, Germany), mounted on a microscope slide and then analyzed by any method of standard histological analysis for each core.
2) Immunohistochemistry
The sections were rewarmed at room temperature and then heated at 60°C for 3 hours. The sections were deparaffinized and hydrated in xylene for 10 minutes, absolute ethanol for 5 minutes, 95% ethanol for 5 minutes, and 70% ethanol for 5 minutes independently. Then, antigen retrieval was performed and streptavidin peroxidase immunohistochemistry was performed according to manufacturer’s instructions.
3) Qualitation
The positive reaction was analyzed with a double-blind method and these sections were independently observed by two experienced pathologists with detail records. The cells showed brownish yellow nuclei or cytoplasm were considered as positive. Ten visual fields under ×400 microscope were selected, and the area of positive expressed, absorbance value (A), and total absorbance value (TA) were analyzed using Image-Pro Plus system (Media Cypernetics, Bethesda, MD, USA). The proportion of RNF positive cells was A/TA.
8. Western blot
Total proteins were extracted with a bicinchoninic acid kit, and 50 μg of proteins mixed with 2×loading buffer followed by separation by sodium dodecyl sulfate-polyacrylamide gel electrophoresis. These proteins were transferred onto nitrocellulose membrane and specific proteins were determined with primary antibody and secondary antibody followed by chemoluminescence. The protein bands were finally visualized using ECL with X-films. The images were subject to grayscale analysis using BandScan software (Glyko, Novato, CA, USA). The expression of protein was normalized by that of GAPDH. The gray ratio was the gray of target proteins to GAPDH.
9. Statistics
Data were expressed as means±SD, and paired data were compared with two tailed t-test. A value of p<0.05 was considered statistically significant.
RESULTS
1. Extraction and purification of RNA
After separation by the agarose gel electrophoresis and the absorbance (A260/A280) ranged from 1.843 to 1.951. Bands were identified at 28S and 18S. These results suggested the content and purity of mRNA were relatively high and meet the requirement of experiment.
2. Detection of differentially expressed genes by microarray
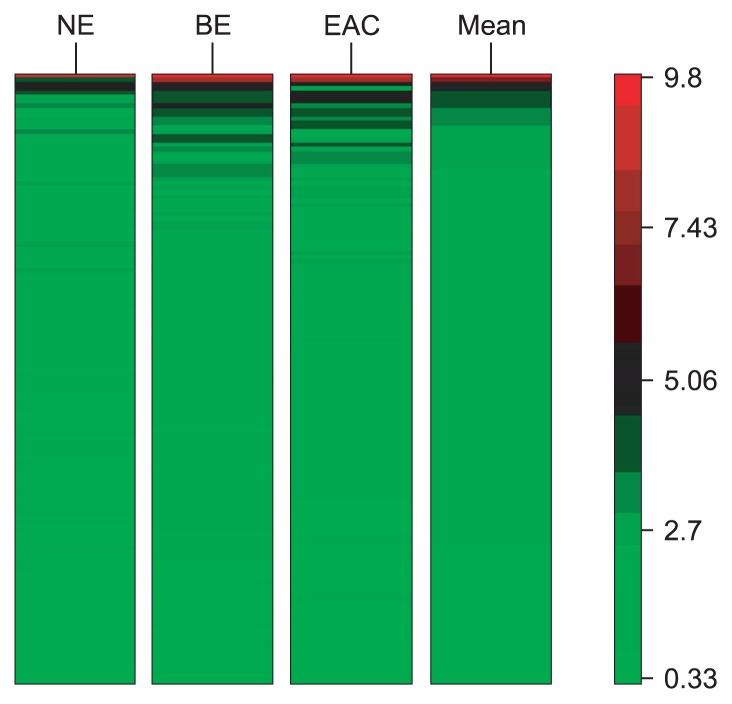
In the present study, six chips were performed, and every chip included more than 30 thousands of genes. There were other genes altered in the microarray except RNFs. Fig. 1 was the heat map of the genes detected in the microarray. It was showed that the expressions of nine RNFs in the BE or EAC were up-regulated by more than 2-fold when compared with NE. Among these genes, the increase in the RNF32 expression in BE was the highest (20.3 folds) followed by RNF121 gene (16.4 folds). In addition, the expressions of RNF24, RNF130, RNF141, RNF139, RNF11, RNF14, and RNF159 were also increased by more than 2 folds when compared with NE. Furthermore, the expressions of these RNFs in EAC were markedly higher than in NE, and closely related to the RNF expressions in BE. The expressions of all RNFs except for RNF141 in EAC were higher than in BE (p < 0.05) (Table 2).
Fig. 1.
The heat map of the genes detected in the microarray. NE, normal esophagus; BE, Barrett esophagus; EAC, esophageal adenocarcinoma.
Table 2.
The RING Finger Genes with Increased Expression in the Barrett Esophagus or Esophageal Adenocarcinoma Compared to Normal Esophagus in the Microarray Assay
| Entrez_gene_ID | Entrez_gene_name | BE vs NE | EAC vs NE | p-value |
|---|---|---|---|---|
| 140545 | RNF32 | 20.3 | 32.1 | 0.0054 |
| 55298 | RNF121 | 16.4 | 23.6 | 0.0176 |
| 11236 | RNF139 | 4.365 | 7.124 | 0.0096 |
| 55819 | RNF130 | 2.687 | 4.245 | 0.0246 |
| 11237 | RNF24 | 2.684 | 4.123 | 0.0321 |
| 26994 | RNF11 | 2.671 | 5.213 | 0.0067 |
| 84333 | RNF159 | 2.509 | 3.657 | 0.0325 |
| 9604 | RNF14 | 2.207 | 4.109 | 0.0398 |
| 50862 | RNF141 | 2.204 | 2.612 | 0.0687 |
BE, Barrett esophagus; NE, normal esophagus; EAC, esophageal adenocarcinoma; RNF, RING finger.
3. mRNA expression
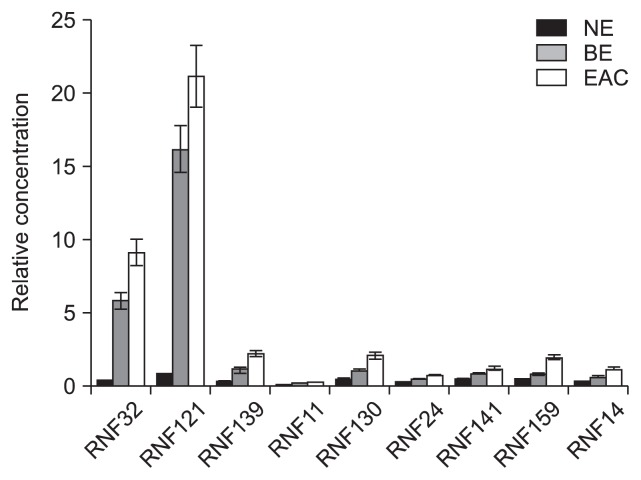
To confirm the expressions of screened RNFs in the microarray assay, real-time quantitative RT-PCR was performed. Results showed the expressions of RNF32, RNF121, RNF139, RNF11, RNF130, RNF24, RNF141, RNF159, RNF14 in the BE and EAC were significantly increased when compared with NE (p=0.000036, p=0.000212, p=0.0157, p=0.039, p=0.0077, p=0.037, p=0.0013, p=0.0017, and p=0.0018, differently), and the increased expressions were more obvious in EAC (p=0.000032, p=0.00018, p=0.0124, p=0.041, p=0.0089, p=0.025, p=0.00021, p=0.00012, and p=0.00012, differently). Furthermore, the expressions of all the RNFs above mentioned, except for RNF141, were markedly elevated in the EAC when compared with BE (p=0.0234, p=0.0147, p=0.025, p=0.042, p=0.0067, p=0.027, p=0.055, p=0.0039, and p=0.0087, differently). These results suggested the RNF expressions determined by PCR were similar to those in microarray assay in expression tendency and expression level (Fig. 2).
Fig. 2.
The mRNA expression of the RING fingers (RNFs) by real-time polymerase chain reaction (RT-PCR). RT-PCR detection revealed that the expression of all RNFs mRNA in the Barrett esophagus (BE) and esophageal adenocarcinoma (EAC) was remarkably higher than those in normal esophagus (NE). Furthermore, the expression of RNFs mRNA (except for RNF141) was also significantly increased compared with those of BE.
4. Protein expressions of RNFs by TMA assay
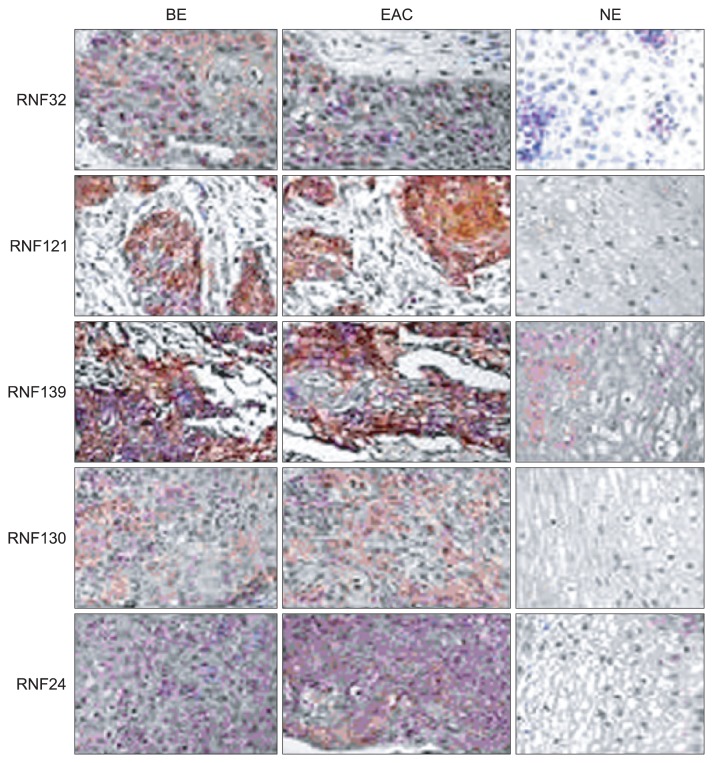
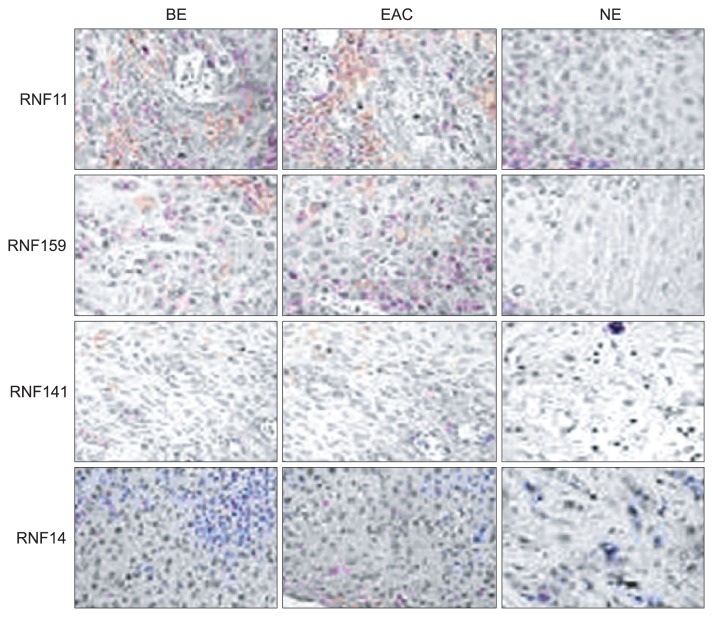
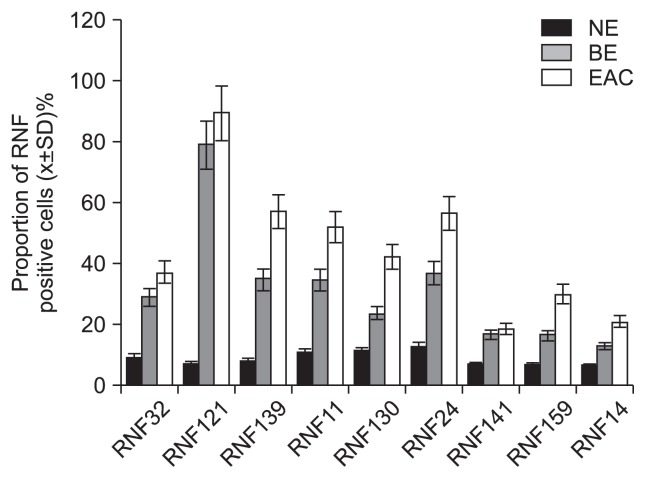
TMA was performed to determine the protein expressions of RNFs in BE and EAC. Results showed RNF positive staining in BE was observed in the cytoplasm and nuclei and characterized by yellow or brown. In NE, weakly positive staining was shown, mainly found in the nuclei and characterized by light yellow or light brown. However, in EAC, strong positive was noted in a lot of cytoplasm and nuclei and characterized by dark yellow or dark brown. Immunohistochemistry revealed the expressions of all RNFs in the BE and EAC were remarkably higher than those in NE (p<0.01). Furthermore, the expressions of RNFs except for RNF141 were also significantly increased when compared with BE (p<0.05) (Figs 3 and 4).
Fig. 3.
Tissue microarray showed that RING finger (RNF) positive staining was observed in the cytoplasm and nuclei and was characterized by yellow or brown coloring. BE, Barrett esophagus; EAC, esophageal adenocarcinoma; NE, normal esophagus.
Fig. 4.
Tissue microarray revealed that the expression of all RING fingers (RNFs) in Barrett esophagus (BE) and esophageal adenocarcinoma (EAC) was remarkably higher than those in normal esophagus (NE). Furthermore, the RNF expression, except for RNF141, was also significantly increased compared with BE.
5. Protein expressions of RNFs by Western blot
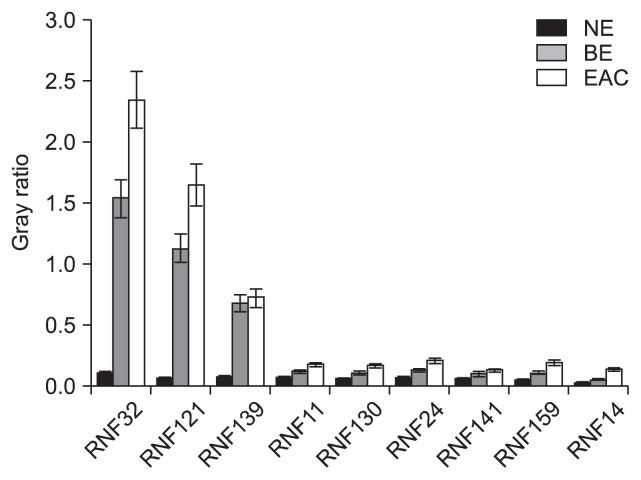
Results demonstrated the expressions of these proteins in BE and EAC were higher than those in the NE (p<0.05), and moreover, the RNF expressions in EAC were markedly increased when compared with BE (p<0.05) (Figs 5 and 6).
Fig. 5.
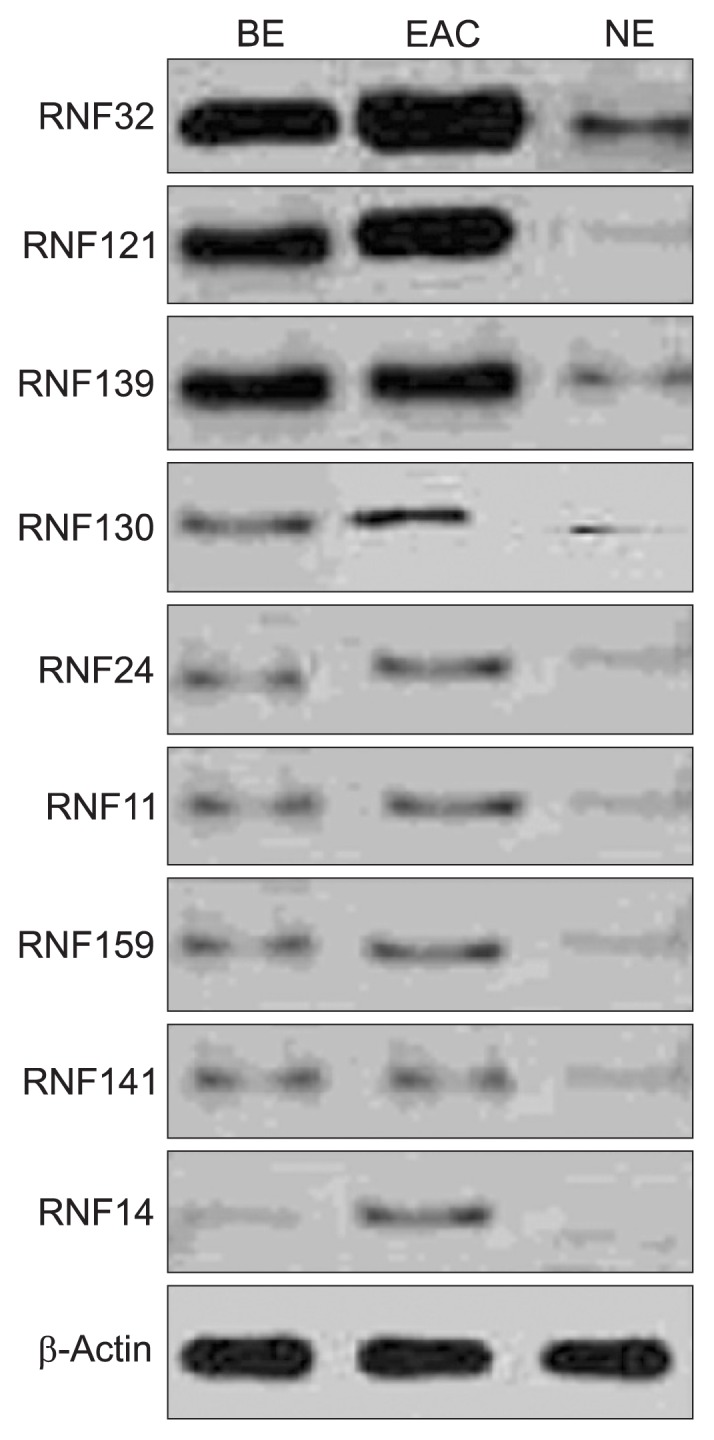
The expression of RING finger (RNF) proteins in Barrett esophagus (BE) and esophageal adenocarcinoma (EAC), as detected by Western blot analysis.
NE, normal esophagus.
Fig. 6.
The Western blot demonstrated that the RING finger (RNF) protein expression in Barrett esophagus (BE) and esophageal adenocarcinoma (EAC) was higher than those in normal esophagus (NE); moreover, the RNF expression in EAC was markedly increased compared with BE.
DISCUSSION
It has been confirmed that BE is a precancerous lesion of EAC, and a study has shown the risk for EAC in patients with BE is 125-fold higher than in general population.3 Generally, EAC derives from BE, and BE is the only risk factor of EAC that has been confirmed.6 The progression of reflux esophagus to BE, to dysplasia and then to malignant transformation has been known to involve in the development of EAC. However, the exact mechanism underlying the development of EAC is still unclear, and maybe abnormal expressions of several genes may cause abnormalities in the epithelial cell proliferation and differentiation resulting in EAC. Studies have revealed increased expressions of a series of oncogenes in BE, and the occurrence, development and progression may be related to the imbalance between oncogenes and tumor suppressor genes.
In previous studies, only one or several genes were investigated to explore the pathogenesis of esophageal cancer, and immunohistochemistry, Southern blot and Northern blot cannot meet the requirement of large-scale and high-throughput hybridization. The introduction of gene chip technology presents the probability to investigate the esophageal cancer related genes with large-scale, high-throughput, and rapidity.7 In the present study, oligonucleotide microarray assay was performed to detect the differentially expressed genes between NE, BE, and EAC to find genes related to the occurrence and development of BE and their association with EAC. Through this method, we can rapidly screen certain molecular markers of BE and/or EAC, which may beneficial for the clinical diagnosis, treatment and prevention of BE.
Microarray assay showed nine differentially expressed RNF genes (RNF32, RNF121, RNF139, RNF130, RNF24, RNF11, RNF159, RNF141, and RNF14) in the BE and EAC and the expressions of these genes were elevated by more than 2 folds when compared with NE. No expressions of RNF genes were observed to be down-regulated and the expressions of RNF32 and RNF121 in the BE and EAC were more than 10 times higher than in the NE. Furthermore, the expressions of all genes, except for RNF141 gene, in the EAC were dramatically higher than in the BE. These findings suggested the RNF family plays important roles in the progression of NE to BE and EAC.
A RNF protein is a type of zinc finger protein containing ring finger motif (Cys3HisCys4) and can bind E3 ubiquitination enzymes and their substrates and hence function as ligase promoting the degradation of target proteins.4,8 Studies have confirmed that lots of RNFs have E3 ligase activity and one of important functions of RNFs is involvement in protein ubiquitination. RNFs can transfer the ubiquitin to the substrates of protease resulting in the degradation of substrates.9 In addition, RNFs can regulation the ubiquitination of substrates involving in the cell growth and development.10 In recent years, studies reveal that the posttranslational modification by ubiquitin and ubiquitin-like proteins implicate in the regulation of several cell activites including cell cycle, signal transduction, immune recognition, cell apoptosis, cell proliferation and differentiation, protein transportation, organ development, inflammation, antigen presenting, regulation of endoplasmic reticulum, DNA repair, stress, and major histocompatibility complex regulation.5,11–17 Increasing evidence demonstrates abnormal E3 ligase expressions in the tumorigenesis and dysregulation of these E3 ligases play crucial roles in the tumorigenesis.18 Studies also propose the abnormalities in E3 ligase expressions can be applied as a molecular marker in the diagnosis of some cancers and as a target in the treatment of these cancers.19–21 RNF32 possesses two ring finger motifs and can regulate the interaction between proteins and DNA/proteins involving in the regulation of spermiogenesis.22 Our results showed RNF32 expression was markedly increased in BE and EAC when compared with NE and even 20 to 30 times higher than that in NE. Furthermore, the RNF32 expression was higher in EAC than in BE. Currently, no study has reported the function of RNF121. In the present study, the RNF121 expression in the BE was 10 times higher than in NE, and that in EAC was further increased when compared with BE.
To validate the results in microarray assay, the mRNA expressions of nine RNF genes were determined by real-time fluorescence quantitative PCR. Results showed the expressions of these genes in PCR were similar to those in microarray assay in expressions tendency and expression level. In addition, the protein expressions of these genes were also determined by using Western blot and TMA followed by immunohistochemistry. Our results showed the protein expressions of RNFs in the BE and EAC were markedly higher than in NE, and moreover, these expressions in EAC were dramatically elevated when compared with BE. The differential expressions of these RNFs implied RNFs play important roles in the progression of BE to EAC.
In summary, in our study, microarray was performed and nine RNF genes had significantly increased expressions in BE and EAC, which were further confirmed by real-time fluorescence quantitative PCR, TMA, and Western blot. Furthermore, the protein and mRNA expressions of these genes were in EAC were markedly higher than in BE. The differential expression of these genes suggested RNFs play critical roles in the progression of BE to EAC. The occurrence and development of EAC is a complex involving several genes and multiple steps in which increased expressions of RNFs play key roles, but exact mechanism should be further studied.
ACKNOWLEDGEMENTS
The study was supported by the National Natural Science Foundation (Grant number: 81071727). We thank Dr. Yuan-Ze Wang for the statistics analysis.
Footnotes
CONFLICTS OF INTEREST
No potential conflict of interest relevant to this article was reported.
REFERENCES
- 1.Shaheen NJ, Richter JE. Barrett’s oesophagus. Lancet. 2009;373:850–861. doi: 10.1016/S0140-6736(09)60487-6. [DOI] [PubMed] [Google Scholar]
- 2.Cook MB, Wild CP, Forman D. A systematic review and meta-analysis of the sex ratio for Barrett’s esophagus, erosive reflux disease, and nonerosive reflux disease. Am J Epidemiol. 2005;162:1050–1061. doi: 10.1093/aje/kwi325. [DOI] [PubMed] [Google Scholar]
- 3.Oberg S, Wenner J, Johansson J, Walther B, Willén R. Barrett esophagus: risk factors for progression to dysplasia and adenocarcinoma. Ann Surg. 2005;242:49–54. doi: 10.1097/01.sla.0000167864.46462.9f. [DOI] [PMC free article] [PubMed] [Google Scholar]
- 4.Freemont PS, Hanson IM, Trowsdale J. A novel cysteine-rich sequence motif. Cell. 1991;64:483–484. doi: 10.1016/0092-8674(91)90229-R. [DOI] [PubMed] [Google Scholar]
- 5.Heuzé ML, Lamsoul I, Moog-Lutz C, Lutz PG. Ubiquitin-mediated proteasomal degradation in normal and malignant hematopoiesis. Blood Cells Mol Dis. 2008;40:200–210. doi: 10.1016/j.bcmd.2007.07.011. [DOI] [PubMed] [Google Scholar]
- 6.Deviere J. Barrett’s oesophagus: the new endoscopic modalities have a future. Gut. 2005;54( Suppl 1):i33–i37. doi: 10.1136/gut.2004.041574. [DOI] [PMC free article] [PubMed] [Google Scholar]
- 7.Xu Y, Selaru FM, Yin J, et al. Artificial neural networks and gene filtering distinguish between global gene expression profiles of Barrett’s esophagus and esophageal cancer. Cancer Res. 2002;62:3493–3497. [PubMed] [Google Scholar]
- 8.Lorick KL, Jensen JP, Fang S, Ong AM, Hatakeyama S, Weissman AM. RING fingers mediate ubiquitin-conjugating enzyme (E2)-dependent ubiquitination. Proc Natl Acad Sci U S A. 1999;96:11364–11369. doi: 10.1073/pnas.96.20.11364. [DOI] [PMC free article] [PubMed] [Google Scholar]
- 9.Fang S, Lorick KL, Jensen JP, Weissman AM. RING finger ubiquitin protein ligases: implications for tumorigenesis, metastasis and for molecular targets in cancer. Semin Cancer Biol. 2003;13:5–14. doi: 10.1016/S1044-579X(02)00095-0. [DOI] [PubMed] [Google Scholar]
- 10.Joazeiro CA, Weissman AM. RING finger proteins: mediators of ubiquitin ligase activity. Cell. 2000;102:549–552. doi: 10.1016/S0092-8674(00)00077-5. [DOI] [PubMed] [Google Scholar]
- 11.Weissman AM. Themes and variations on ubiquitylation. Nat Rev Mol Cell Biol. 2001;2:169–178. doi: 10.1038/35056563. [DOI] [PubMed] [Google Scholar]
- 12.Nakayama K, Qi J, Ronai Z. The ubiquitin ligase Siah2 and the hypoxia response. Mol Cancer Res. 2009;7:443–451. doi: 10.1158/1541-7786.MCR-08-0458. [DOI] [PMC free article] [PubMed] [Google Scholar]
- 13.Hibbert RG, Mattiroli F, Sixma TK. Structural aspects of multi-domain RING/Ubox E3 ligases in DNA repair. DNA Repair (Amst) 2009;8:525–535. doi: 10.1016/j.dnarep.2009.01.014. [DOI] [PubMed] [Google Scholar]
- 14.Ishido S, Goto E, Matsuki Y, Ohmura-Hoshino M. E3 ubiquitin ligases for MHC molecules. Curr Opin Immunol. 2009;21:78–83. doi: 10.1016/j.coi.2009.01.002. [DOI] [PubMed] [Google Scholar]
- 15.Neutzner A, Benard G, Youle RJ, Karbowski M. Role of the ubiquitin conjugation system in the maintenance of mitochondrial homeostasis. Ann N Y Acad Sci. 2008;1147:242–253. doi: 10.1196/annals.1427.012. [DOI] [PubMed] [Google Scholar]
- 16.Brooks L, 3rd, Heimsath EG, Jr, Loring GL, Brenner C. FHA-RING ubiquitin ligases in cell division cycle control. Cell Mol Life Sci. 2008;65:3458–3466. doi: 10.1007/s00018-008-8220-1. [DOI] [PMC free article] [PubMed] [Google Scholar]
- 17.Yang Y, Yu X. Regulation of apoptosis: the ubiquitous way. FASEB J. 2003;17:790–799. doi: 10.1096/fj.02-0654rev. [DOI] [PubMed] [Google Scholar]
- 18.Ardley HC. Ring finger ubiquitin protein ligases and their implication to the pathogenesis of human diseases. Curr Pharm Des. 2009;15:3697–3715. doi: 10.2174/138161209789271807. [DOI] [PubMed] [Google Scholar]
- 19.Chasapis CT, Spyroulias GA. RING finger E(3) ubiquitin ligases: structure and drug discovery. Curr Pharm Des. 2009;15:3716–3731. doi: 10.2174/138161209789271825. [DOI] [PubMed] [Google Scholar]
- 20.Sun Y. Targeting E3 ubiquitin ligases for cancer therapy. Cancer Biol Ther. 2003;2:623–629. doi: 10.4161/cbt.2.6.677. [DOI] [PubMed] [Google Scholar]
- 21.Yamamoto T, Tanigawa N. The role of survivin as a new target of diagnosis and treatment in human cancer. Med Electron Microsc. 2001;34:207–212. doi: 10.1007/s007950100017. [DOI] [PubMed] [Google Scholar]
- 22.van Baren MJ, van der Linde HC, Breedveld GJ, et al. A double RING-H2 domain in RNF32, a gene expressed during sperm formation. Biochem Biophys Res Commun. 2002;292:58–65. doi: 10.1006/bbrc.2002.6612. [DOI] [PubMed] [Google Scholar]


