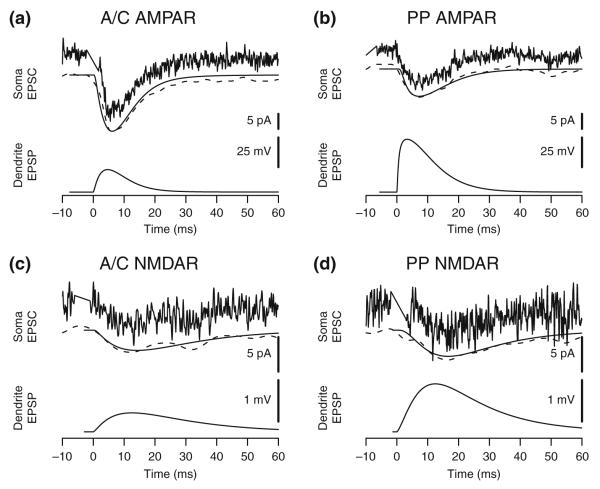
Fig. 2.
Typical response traces from model and experimental results. (a) AMPA receptor responses from A/C stimulations (experiment) and SR synapses (model). (b) AMPA receptor responses from PP stimulations (experiment) and SLM synapses (model). (c) NMDA receptor responses from A/C stimulations (experiment) and SR synapses (model). (d) NMDA receptor responses from PP stimulations (experiment) and SLM synapses (model). Typical experimental traces (noisy line above) from individual data sweeps are shown with smoothed data (dotted line below) from the same sweep overlaid with a comparable model response (solid line below) for comparison. Local dendritic EPSP at the site of the synapse is from the model. Time is relative to onset of synaptic activation. Stimulation artifacts have been removed from the experimental data

