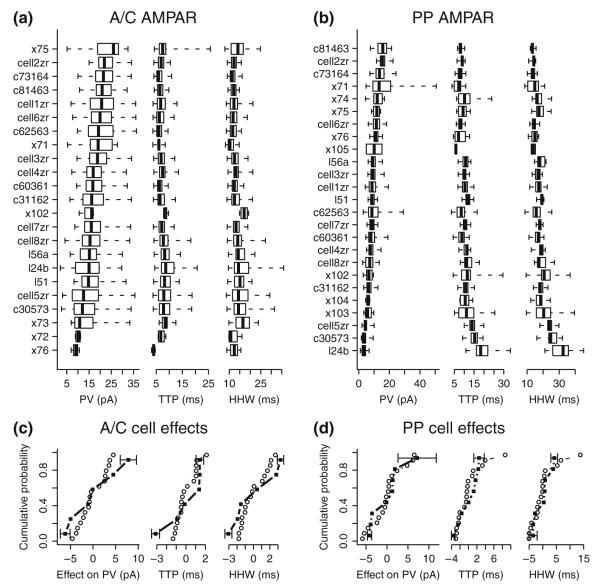
Fig. 3.
Distribution of model and experimental cell AMPA receptor responses. (a) Box-and-whiskers plots of A/C AMPA receptor synaptic responses from each simulated cell and each experimental cell showing PV, TTP, and HHW distributions. Cell names beginning with “x” indicate experimental cells. Whiskers indicate the range of response values, and boxes the second and third quartiles with the median indicated as a solid vertical line. Cells are ordered by PV median within each category of responses. (b) Box-and-whiskers plots of PP AMPA receptor synaptic responses, as above. (c) Cumulative distribution of cell effects on mean A/C AMPAR PV, TTP, and HHW for model cells (circles) and experimental cells (squares). Standard errors of the mean are shown as error bars for experimental cells with the minimum and maximum effects. For purposes of this analysis, each cell received equal weighting irrespective of the total number of unitary responses for the cell. Kolmogorov-Smirnov tests comparing model and experimental effects distributions do not show significant differences for PV, TTP, or HHW (p-values .58, .25, and .41, respectively). (d) Cumulative distribution of cell effects for PP AMPAR, as above. Distributions are not significantly different (p-values .78, .49, and .49, respectively)

