Fig. 6.
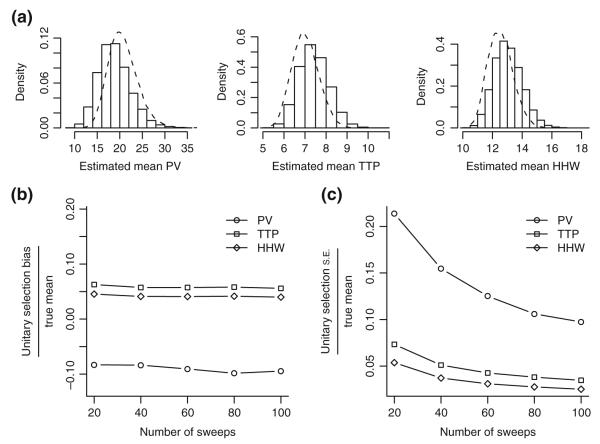
Post-hoc analysis of unitary selection methods. Effects of unitary selection are estimated using a probability model of failures and multiple responses. Responses were drawn from cell1zr model results with randomized synaptic conductance (Fig. 5(c)). Monte Carlo trials (N=10,000) were used to obtain the distribution of estimated mean unitary response properties (see section 2). (a) Density histograms of means estimated using the unitary selection method for PV, TTP, and HHW assuming 50 sweeps in the experiment and an observable failure rate of 30%. The density of ideal means that would have resulted if there were no errors in unitary selection is shown as dashed lines. (b) Bias in the unitary mean estimator as compared with the ideal mean estimator, i.e. the mean difference between the two, divided by the true cell mean for different numbers of sweeps in the experiment. True cell1zr means are 20.9 pA, 7.0 ms, and 12.5 ms for PV, TTP, and HHW, respectively. (c) Standard error of the unitary selection estimator as compared with the ideal estimator, i.e. the standard deviation of the difference between the two, divided by the true cell mean for different numbers of sweeps in the experiment

