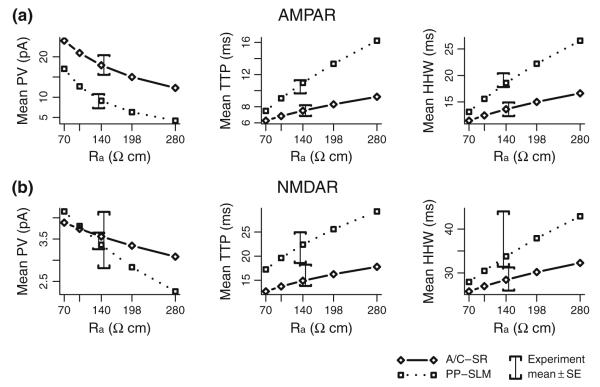
Fig. 7.
Sensitivity of model results to axial resistivity. (a) Model mean PV, TTP, and HHW for AMPA receptor synaptic responses are shown for axial resistivity values of 70, 99, 140, 198, and 280 Ωcm and for synapses located in SR (solid lines) and SLM (dotted lines). Comparable experimental means ± SE are shown as error brackets with PP offset to the left from A/C to reduce over plotting. (b) Model and experimental results for NMDA receptor synaptic responses, as above

