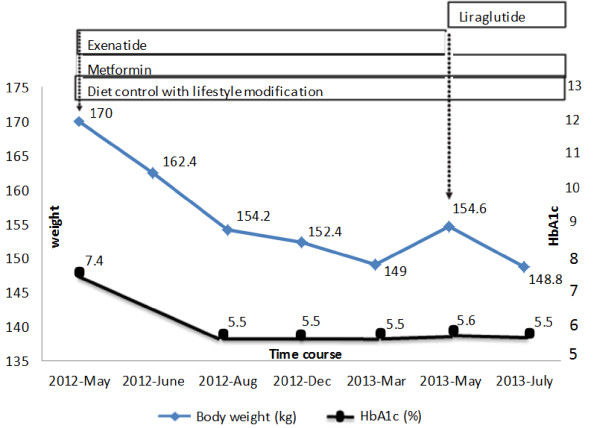
Figure 1.

Course of treatment graph showing the corresponding effect on weight and HbA1c level. The duration of treatment with diet control, lifestyle modifications and pharmacological agents in our patient is represented by the length of each box relative to the time period on the x-axis. Changes in HbA1c are shown by the black circle line plotted against the y-axis (right), and changes in weight are shown by the blue rhombus line plotted against the y-axis (left). Significant improvement in glycemic control and sustained weight loss after metformin and exenatide is shown.
