
Figure 4. Quantification of fluorescence of doxorubicin and DiO in prostate cancer cells exposed to SPRL and SSL.
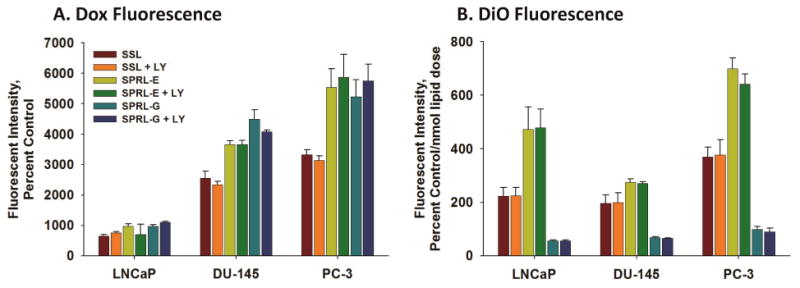
LNCaP, DU-145, and PC-3 cells were treated with dual-labeled liposomes for 72 hours and examined with flow cytometry. Panel A shows the intensity of doxorubicin fluorescence while panel B shows the intensity of DiO fluorescence normalized by the nmol dose of lipid. Data are presented as the mean +/- SEM of at least 3 different experiments. Differences were considered significant with a P < 0.05.